Debug Analyzer
Debug Analyzer is a tool used for capturing and decoding logs of Realtek Bluetooth SoC chip. The following ICs are supported. This document provides detailed guidance on how to set and use it.
No. |
Supported ICs |
|---|---|
1 |
RTL8762A |
2 |
RTL8762C |
3 |
RTL8762D |
4 |
RTL8762E |
5 |
RTL87x2G |
6 |
RTL8752H |
7 |
RTL8772F |
8 |
RTL8763B |
9 |
RTL8773B |
10 |
RTL8763C |
11 |
RTL8773C |
12 |
RTL8763E |
13 |
RTL8773E |
14 |
RTL8753B |
The document comprises the following chapters.
Chapter 1: Introduction.
Chapter 2: Provides an overview of Debug Analyzer.
Chapter 3: Describes how to configure the tool and decode logs.
Chapter 4: Describes how to operate decoded output (logs) on UI.
Chapter 5: Describes how to view Bluetooth HCI log with Ellisys in real time.
Chapter 6: Describes the extended functions included in Debug Analyzer.
Overview of Debug Analyzer Tool
Overview of Main Dialog
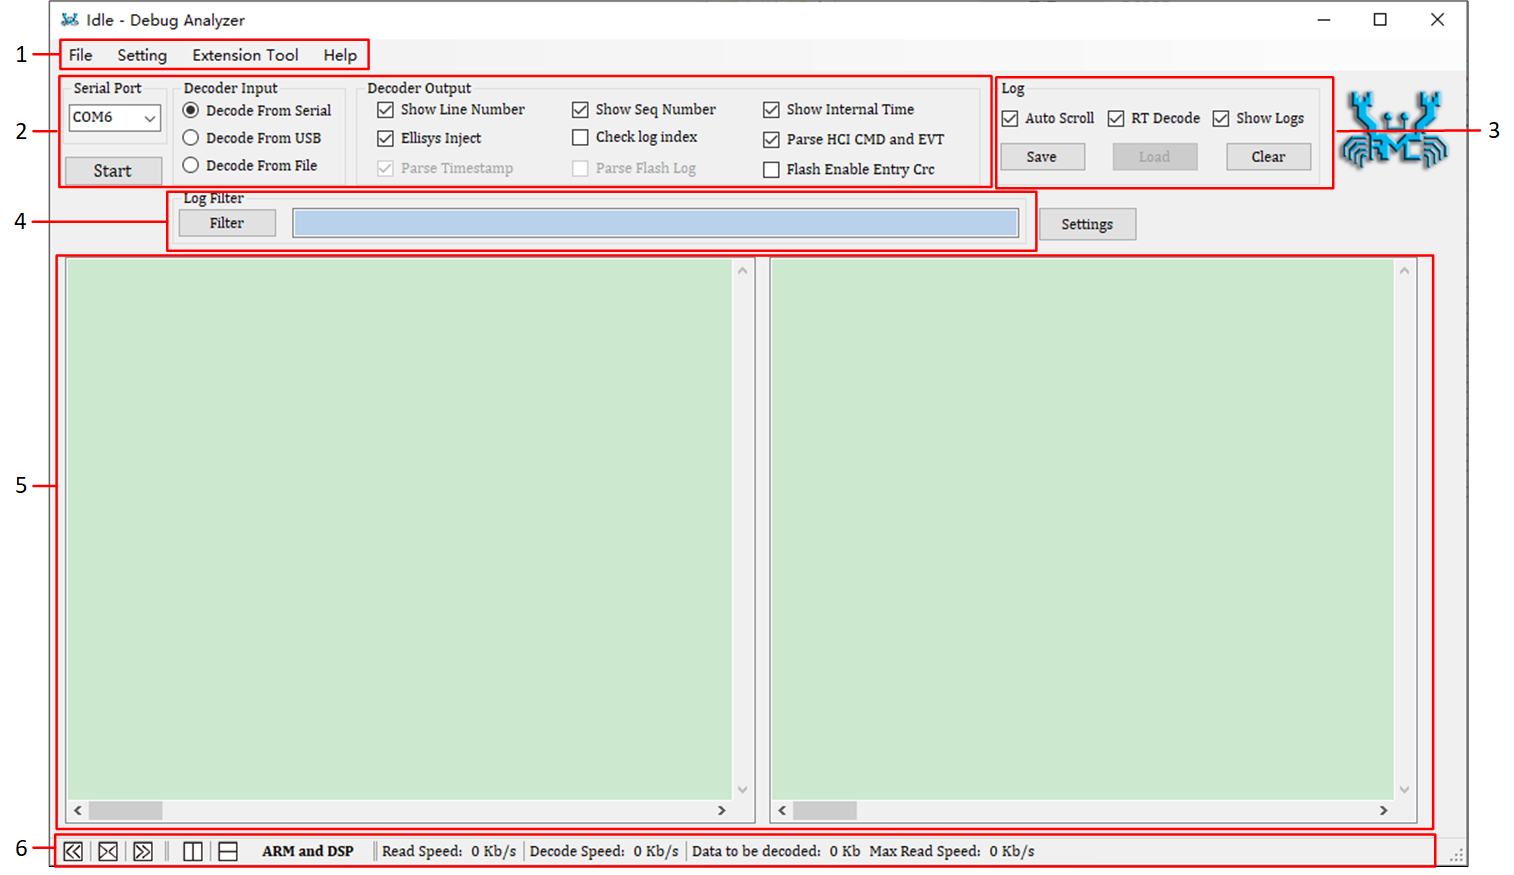
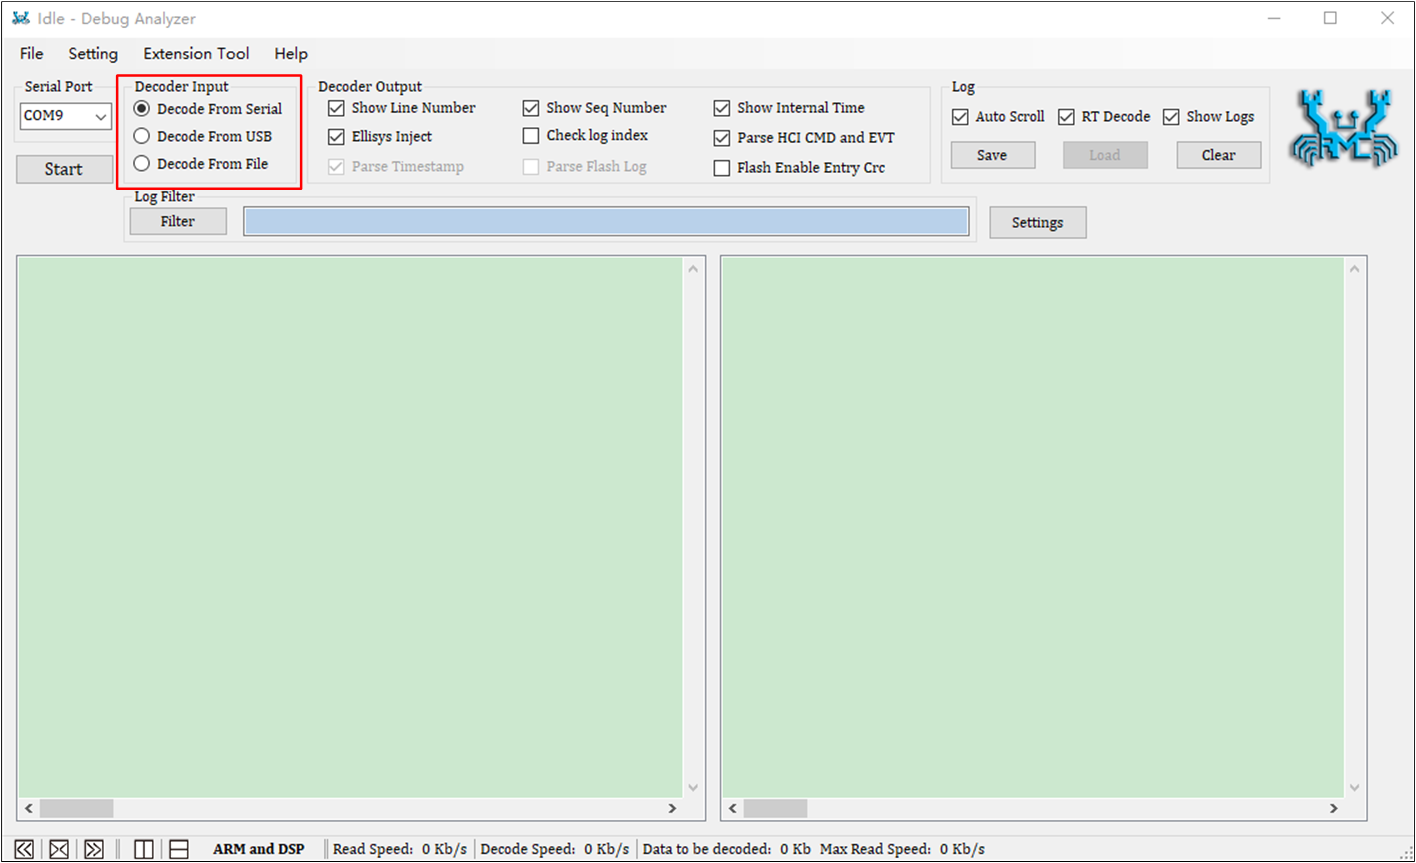
Overview of Main Dialog is the main dialog of Debug Analyzer, which is divided into 6 functional areas. The simple functions are described as follows.
Menu bar, contains extended settings and operations of Debug Analyzer Tool.
Contains the optional parsing methods and parsing Log output settings.
Modify log display.
Filter logs by keywords.
Log display area, mainly includes the ARM area and the DSP area, which are used to show the ARM Log and DSP Log respectively.
Set the log display mode, and display the log reading and parsing speed.
Overview of Detail Settings Dialog
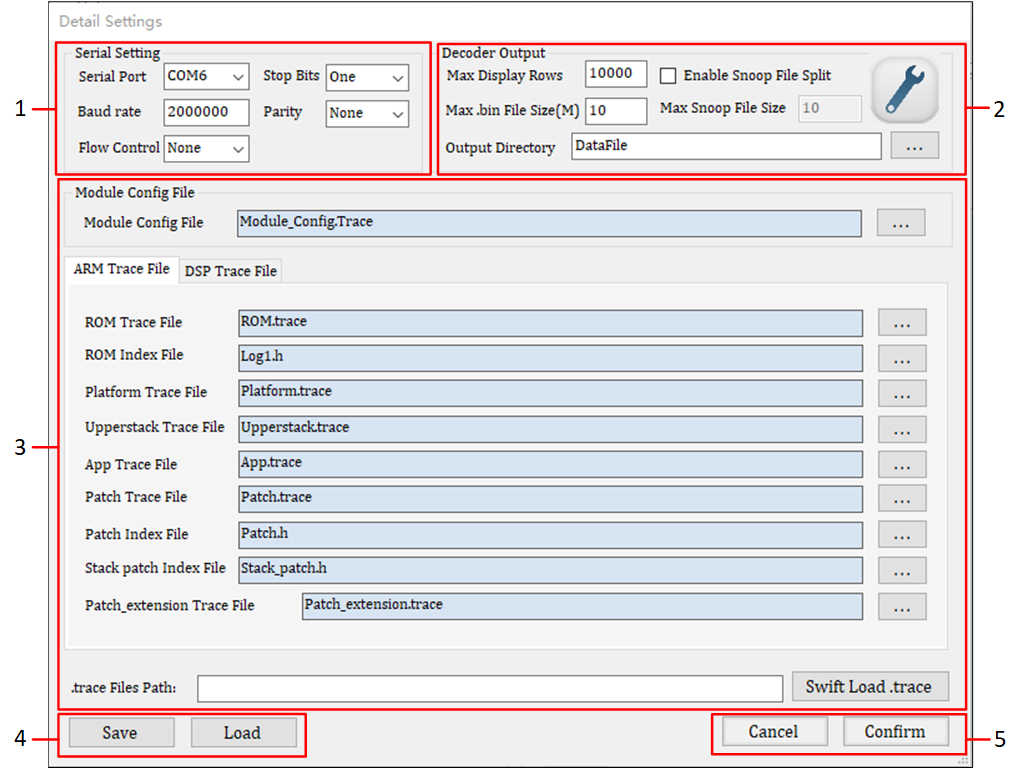
The Detail Settings dialog is divided into 5 functional areas. The simple functions are described as follows.
Contains the changeable serial port settings.
The supplement of decoder output display and file save settings.
Set
.tracefile paths.Save or load detail settings by
.inifile.Cancel or confirm current settings.
Preparing
Real-time Log Capture and Decode
If real time log capture is needed, connect PC and SoC chip via serial
port. The raw data captured from SoC can be saved in a .bin file. It can
be decoded to plaintext logs according to the .trace file set by the
user, and these logs can then be saved in the .log.
Note
Please make sure that the .trace file matches the current SoC running code.
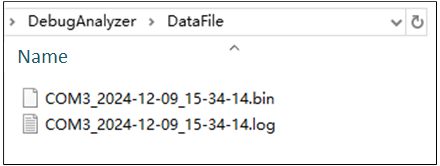
Overview of Detail Settings Dialog shows the raw data file (.bin), output log file (.log). The default save location is the DataFile folder in the same directory as Debug Analyzer.
Overview of Detail Settings Dialog
Local .bin Decode
For local decoding, there is no need to connect PC and SoC chip, but
.binfiles which are being decoded need to be prepared.For example, use
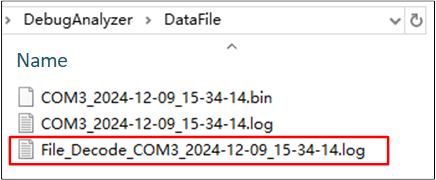
COM3_2024-12-09_15-34-14.binin Overview of Detail Settings Dialog , select Decode from File in Decode Input, refer to Log Decoding Type and Table Decoder Input Selections.Wait for the parsing to complete, and users can find the result in the
.logfile with 'File_Decode_' prefix, as shown in Local .bin Decode Output File .
Local .bin Decode Output File
Settings of Debug Analyzer Tool
Settings of Main Dialog
Selections of Decoding Type
Log Decoding Type
The following table describes the specific meaning of each option in the Decoder Input part.
Option |
Selection |
Description |
|---|---|---|
Decoder Input |
Decode From Serial |
If selected, the raw data is captured from serial port. It is Real-time decode (RT Decode). |
Decode From USB |
If selected, the raw data is captured from USB. It is Real-time decode (RT Decode). |
|
Decode From File |
If selected, the raw data is retrieved from the It is called local decoding. For example, if it is found that the wrong trace file is used, the
user only needs to use the Description: Multiple |
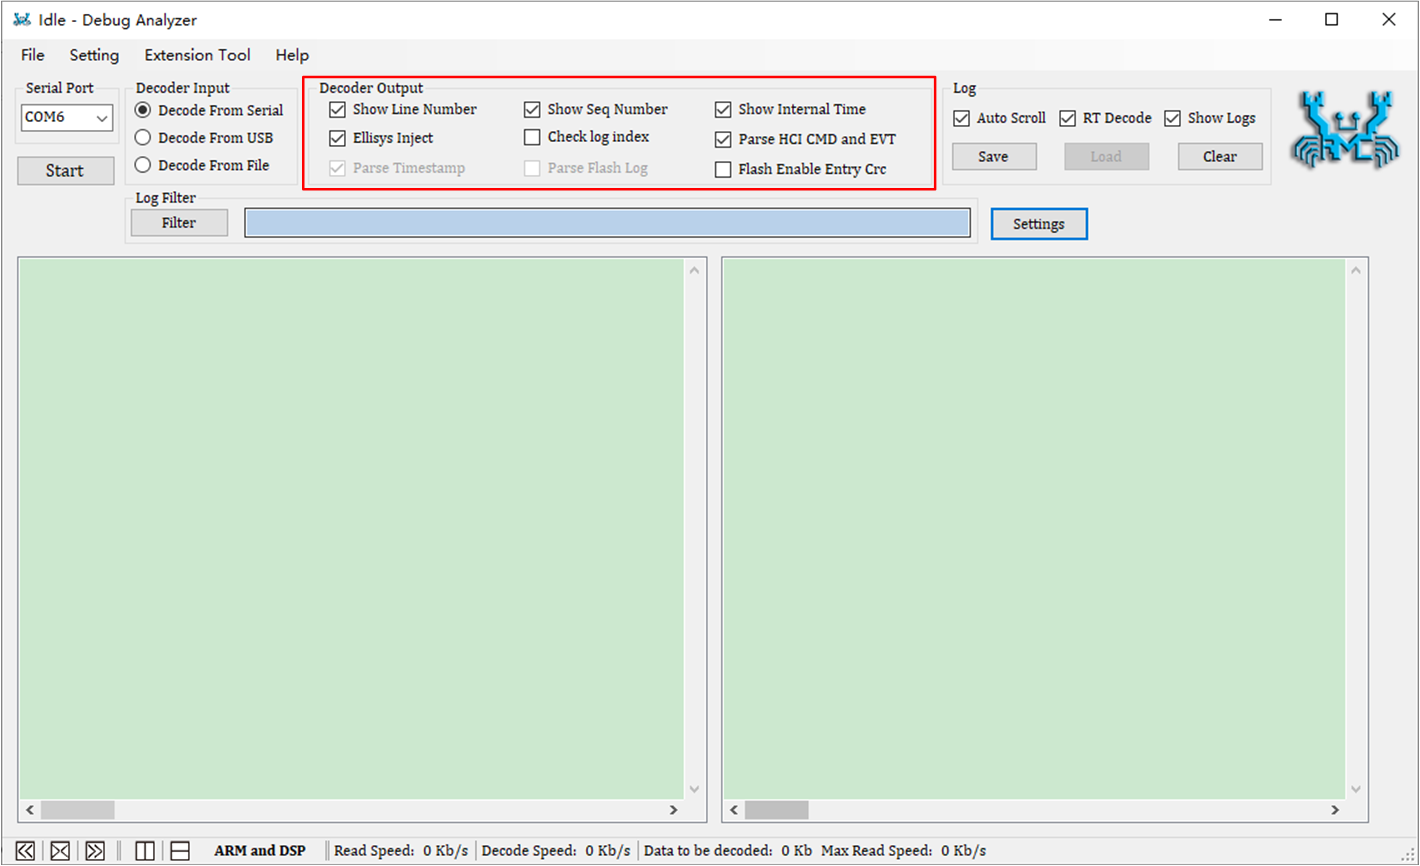
Settings of Decoder Output
The Decoder Output area of the main page contains the commonly used parsing output parameter configurations Decoder Output Settings.
All parameters can be configured on the Decoder Output Settings page (Decoder Output Settings From).
The method of using the Decoder Output Settings page: Select from the menu bar (Decoder Output Settings From).
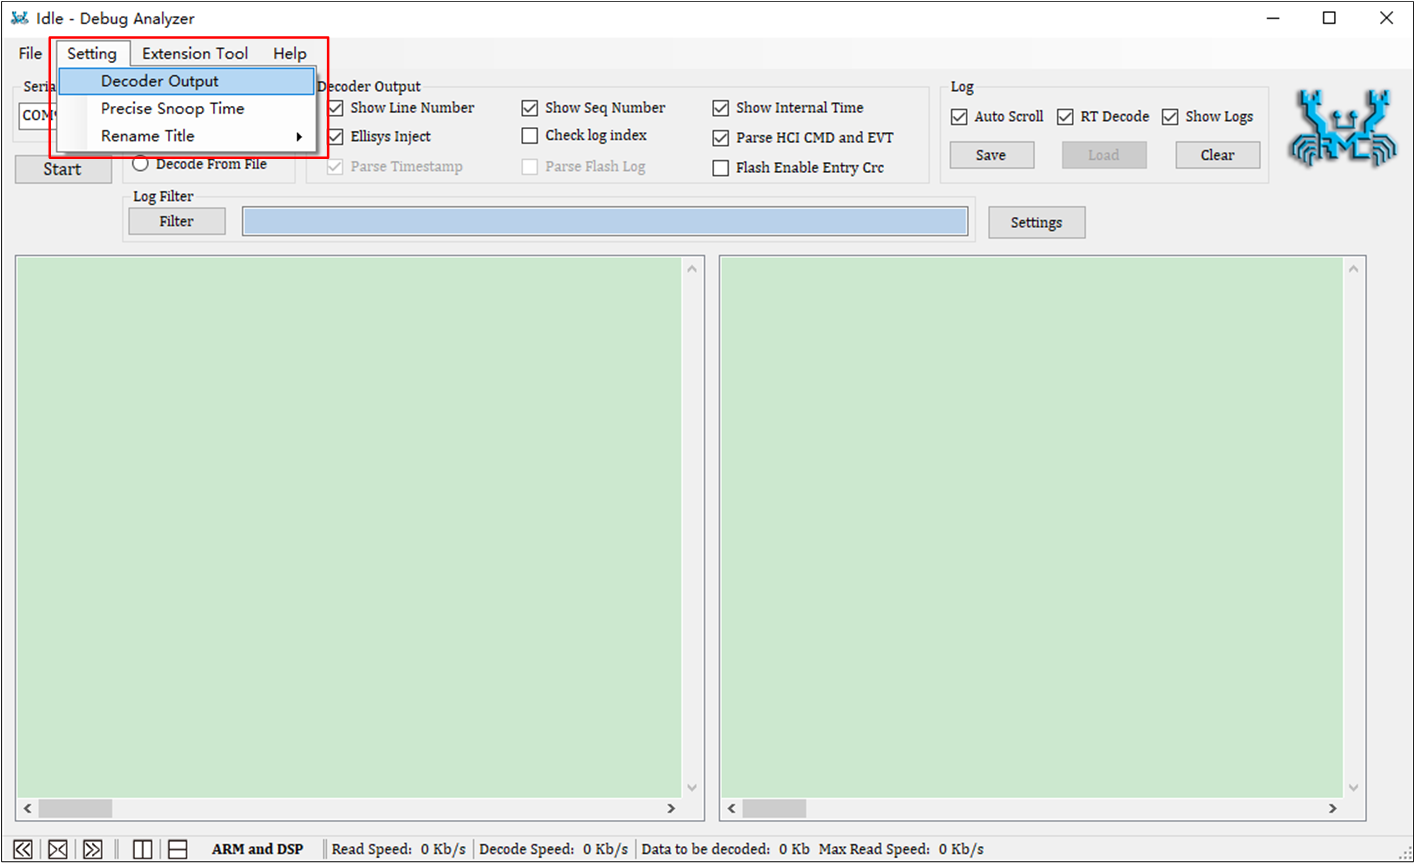
Setting-Decoder Output
Decoder Output Settings
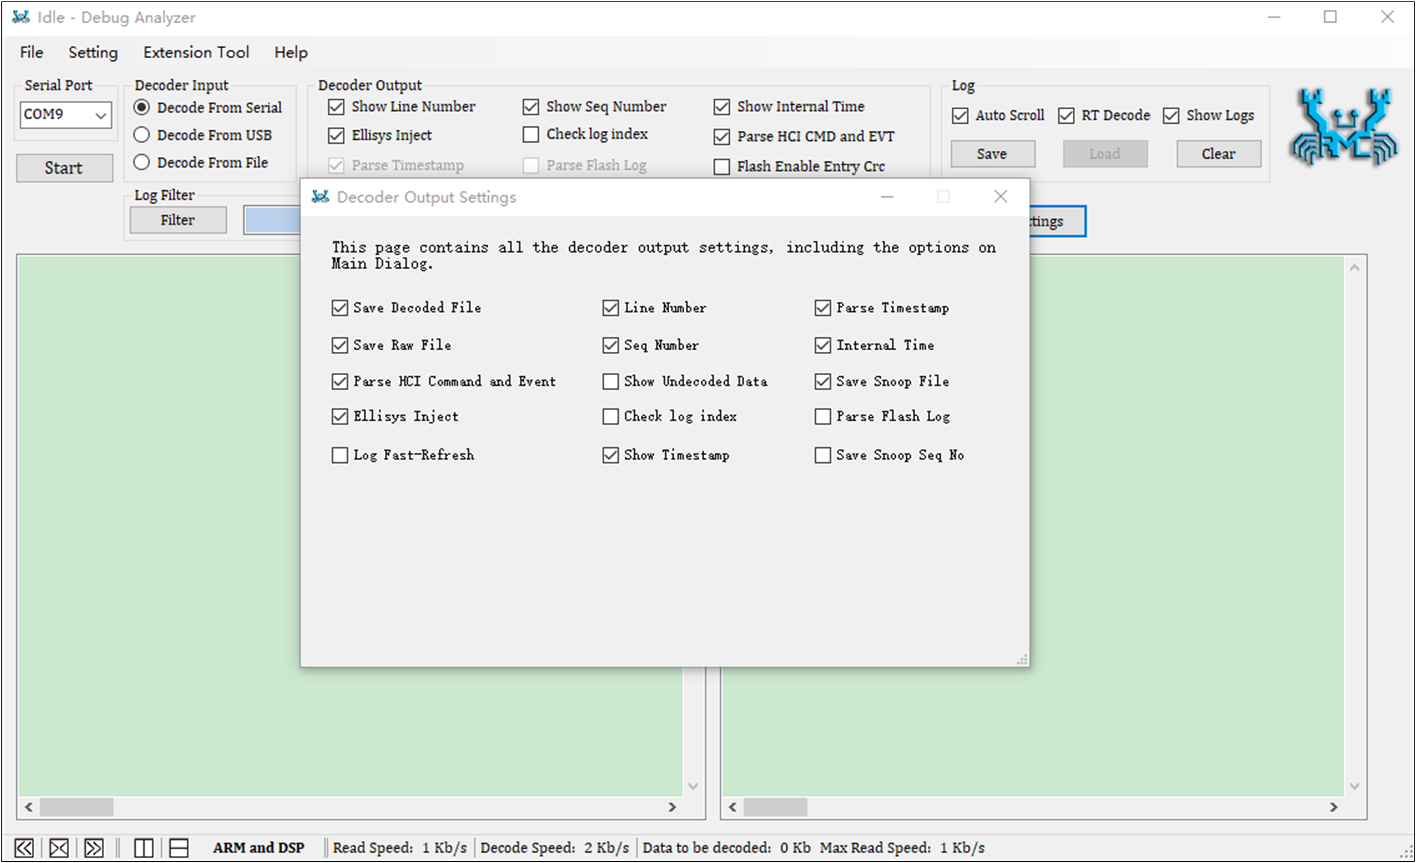
Decoder Output Settings From
Option |
Selection |
Description |
|---|---|---|
Decoder Output |
Save Decoded File |
If checked, the output logs are saved in a If not checked, the output logs are not saved in a |
Save Raw File |
If checked, the raw data captured from bus (serial port/USB) is saved in |
|
Parse HCI Command and Event |
If checked, the tool parses HCI command and event and displays logs on the UI. If not checked, the tool does not parse the HCI command and event. |
|
Line Number |
If checked, the 'line number' is included in the output logs. 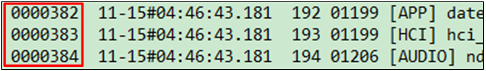
If not checked, the 'line number' is not included in the output logs. |
|
Seq Number |
If checked, the 'sequence number' is included in the output logs. 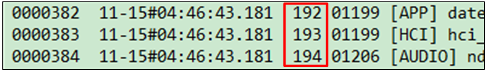
If not checked, the 'sequence number' is not included in the output logs. The range of sequence number is 0~255. If one sets all required |
|
Parse Timestamp |
When decoding from serial/USB, this item is always checked. When decoding from file, this item is changeable. If checked, the timestamp of the logs will not be parsed. If not checked, the timestamp of the logs will not be parsed. The 'timestamp' is added by the Debug Analyzer Tool. If the raw data is captured by the Debug Analyzer, this item must be checked, otherwise, the decoded logs will be missing. If the raw data is captured by another tool, this item should not be checked, or decoded logs will be missing. |
|
Internal Time |
If checked, 'internal time' is included in the output logs.(Unit: ms)e.g. The 'Internal Time' format before RTL87x3E. 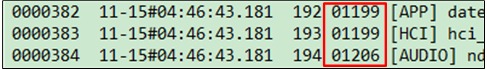
The 'Internal Time' format after RTL87x3E. 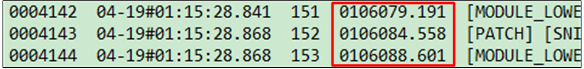
If not checked, 'internal time' is not included in the output logs. Internal time is the timestamp provided by the Bluetooth SoC chip. Note: 'internal time' is generated by SoC. |
|
Show Undecoded Data |
If checked, the raw data is appended by the decoded log. e.g. 0000002 08-18#10:28:55.345 000 35127 >>> Boot Patch (Raw Data: 7E-16-00-68-37-89-20-00-3E-3E-3E-20-42-6F-6F-74-20-50-61-74-63-68) If not checked, the raw data is not appended to the decoded log. |
|
Save Snoop File |
If the SoC chip provides HCI information to application, a More details are provided in section Real-time display of BTSnoop Log. After version v3.0.0.10, this item is invalid. |
|
Ellisys Inject |
If checked, HCI data will be sent to the application 'Ellisys'. More details are provided in chapter How to Use Ellisys View Package of BTSnoop . |
|
Parse Flash Log |
If checked, the log bin file from flash dump will be parsed. Only Decode From File mode can be checked. |
|
Log Fast-Refresh |
If checked, the page refresh rate is 0.1s. If not checked, the page refresh rate is 1s (default). |
|
Show Timestamp |
If checked, the timestamp of the logs will be shown on UI. e.g. 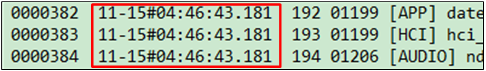
If not checked, the timestamp of the logs will not be shown on UI. |
Log Settings
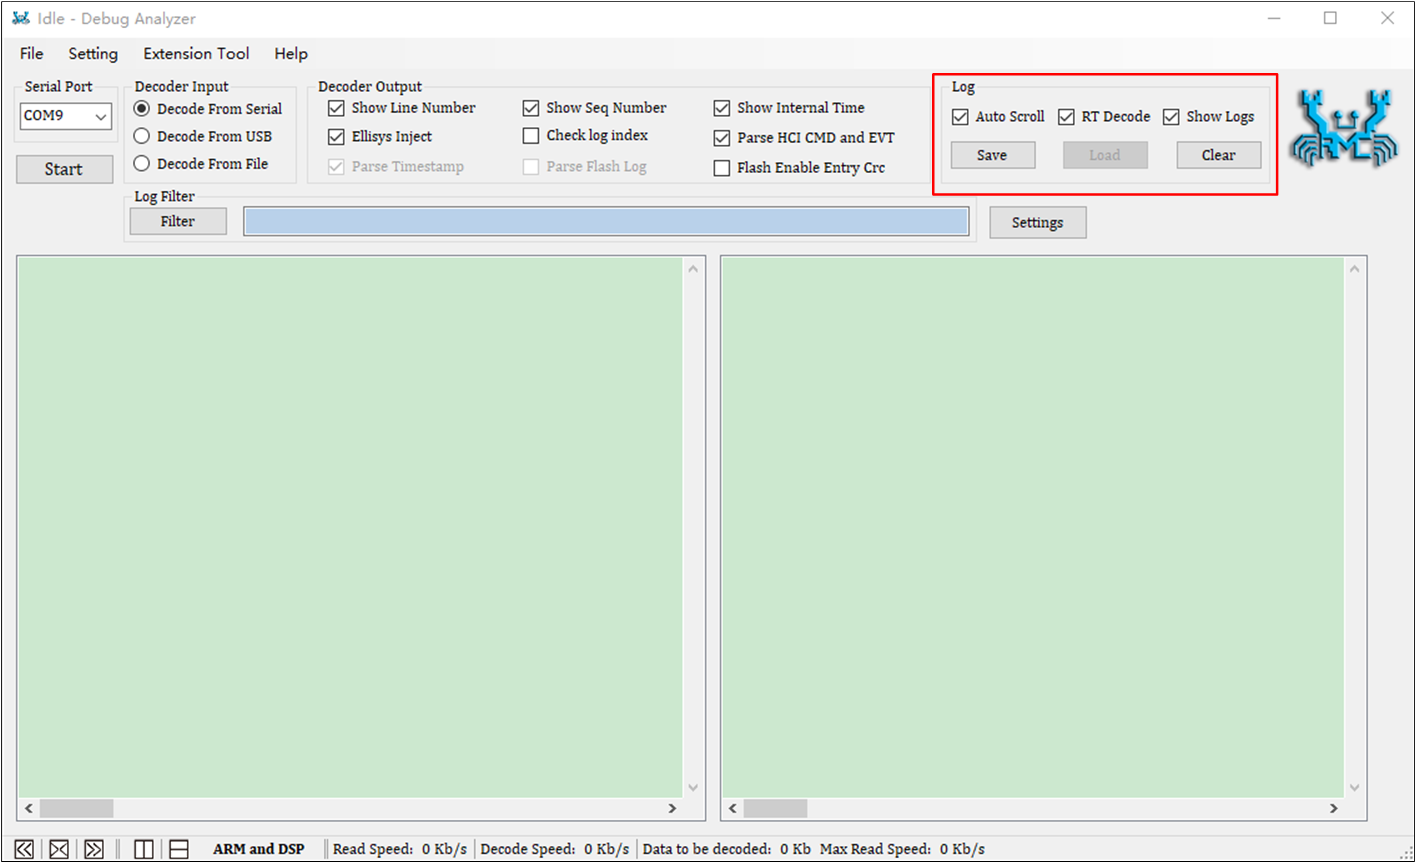
Log Settings
The following table describes the specific meaning of each option in the Log part.
Option |
Selection |
Description |
|---|---|---|
Log |
Auto Scroll |
If checked, the logs shown on the UI will scroll automatically during decoding. If not checked, the logs shown on the UI will not scroll automatically. |
RT Decode |
If checked, the tool will capture and save the raw data, and then decode it. If not checked, the tool will capture and save the raw data but will not decode it. |
|
Show Logs |
If checked, the tool will capture raw data, decode it, and display the logs on the UI. If not checked, the tool will capture and save the raw data but will not display the logs on the UI. |
Settings of Detail Settings Dialog
Settings of Serial Port
If Decode From Serial is selected, make sure to configure Serial Port (Serial Port Settings).
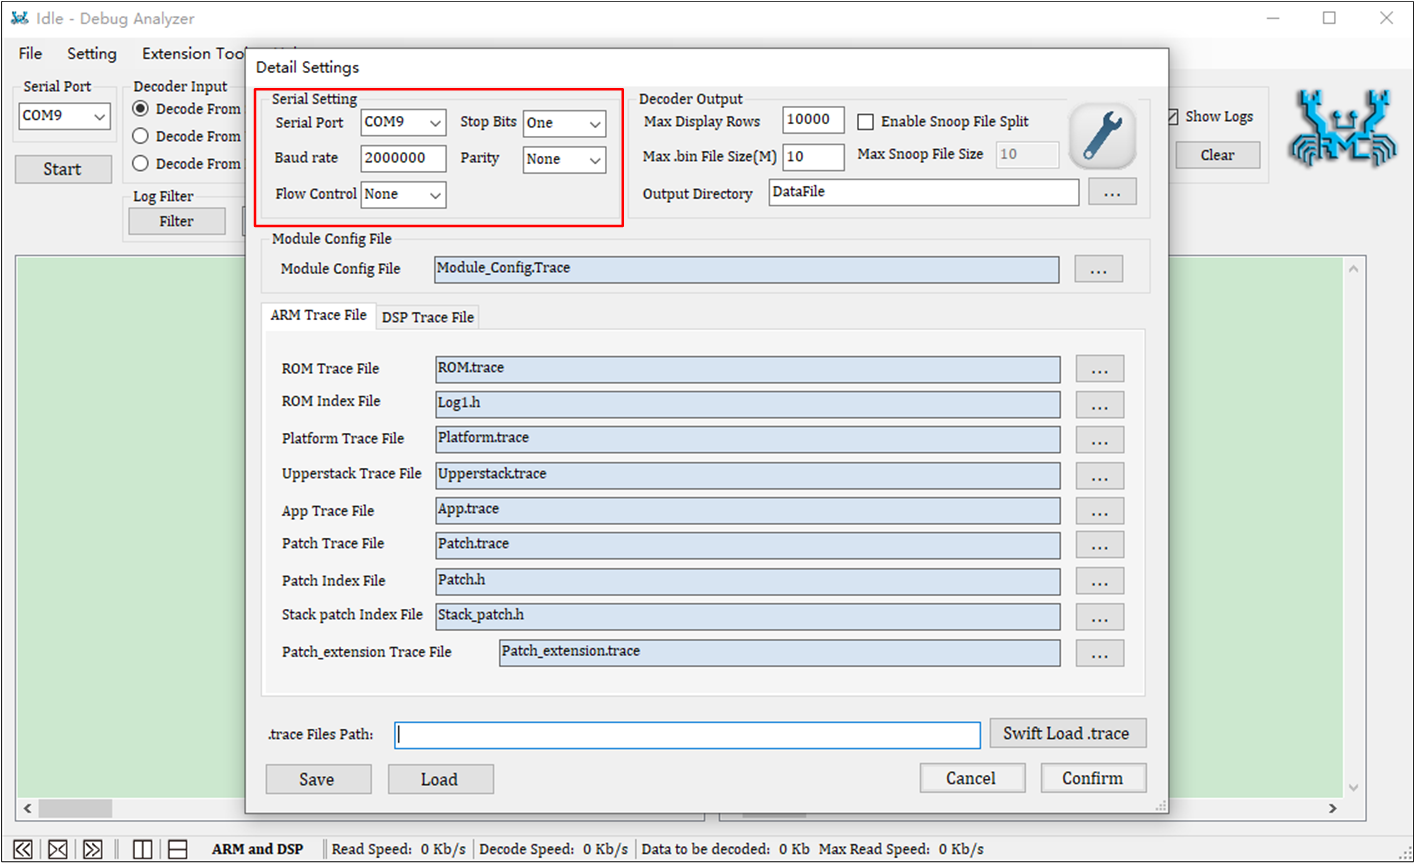
Serial Port Settings
The following table describes the specific meaning of each option in the Serial Setting part.
Area |
Setting |
Description |
|---|---|---|
Serial Setting |
Serial Port |
Set serial port number. |
Baud Rate |
Set the baud rate of data transfer. |
|
Parity |
Set the mode of parity. |
|
Stop Bits |
Set the stop bits. |
|
Flow Control |
Set the mode of flow control, generally, 'None' is chosen. |
Settings of Decoder Output
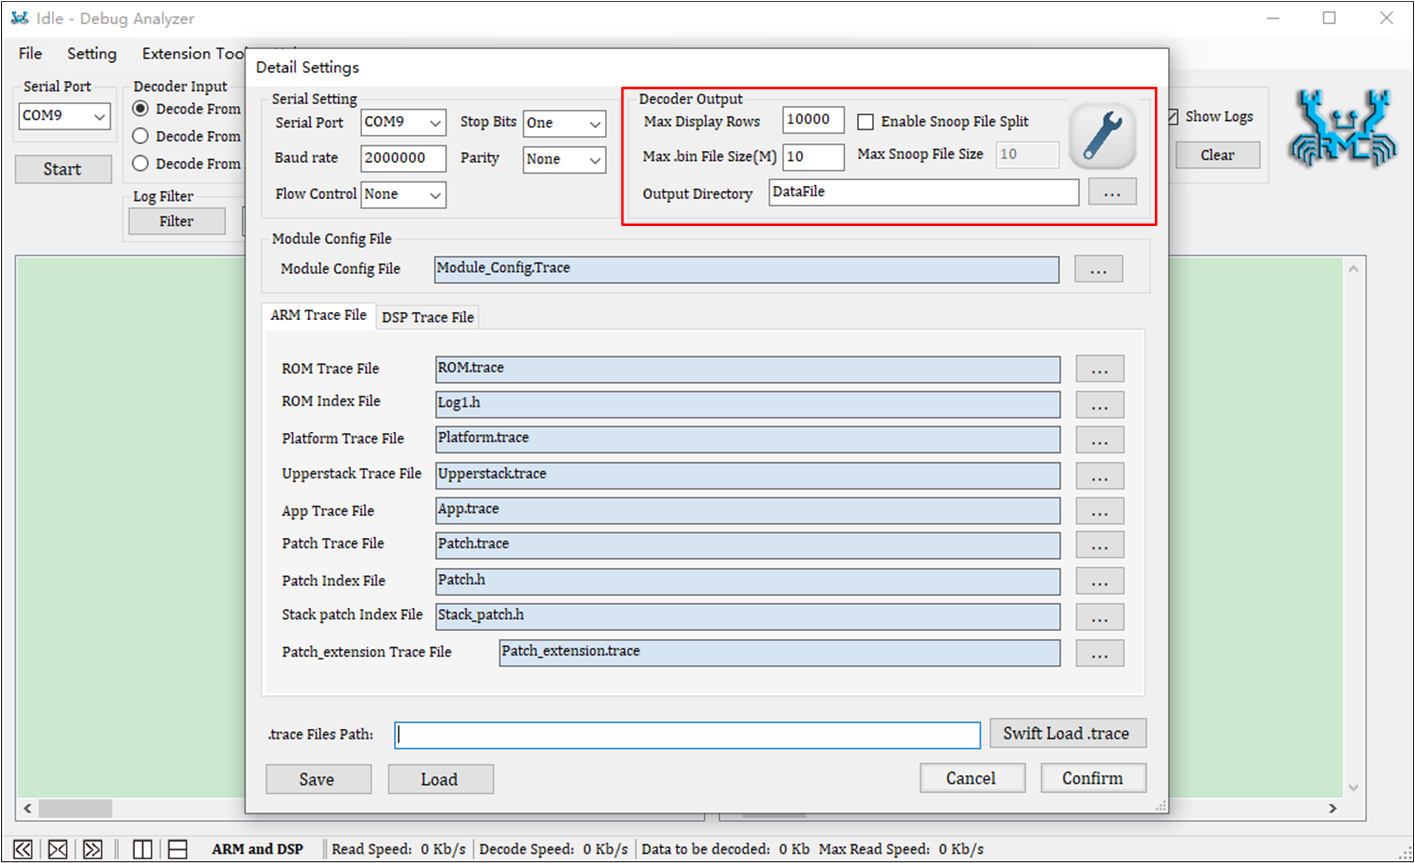
Decoder Output Settings
The following table describes the specific meaning of each option in the Decoder Output part.
Area |
Setting |
Description |
|---|---|---|
Decoder Output |
Max Display Rows |
Set the maximum number of log rows to be displayed on the UI. If the logs shown on the UI exceed the maximum row number, the display area will be emptied. |
Max |
Set the maximum size of log file. If the log file size exceed the maximum size, a new log file will be generated. |
|
Enable Snoop File Split |
If checked, setting the 'Max Snoop File Size' is required. If the file reaches the maximum snoop file size, the tool creates a new If not checked, only a Note: It is recommended to select only when the log volume is large, to avoid the |
|
Max Snoop File Size |
Set the maximum size of |
|
Output Directory |
Specify the directory of the folder that contains the |
Settings of Trace File Path
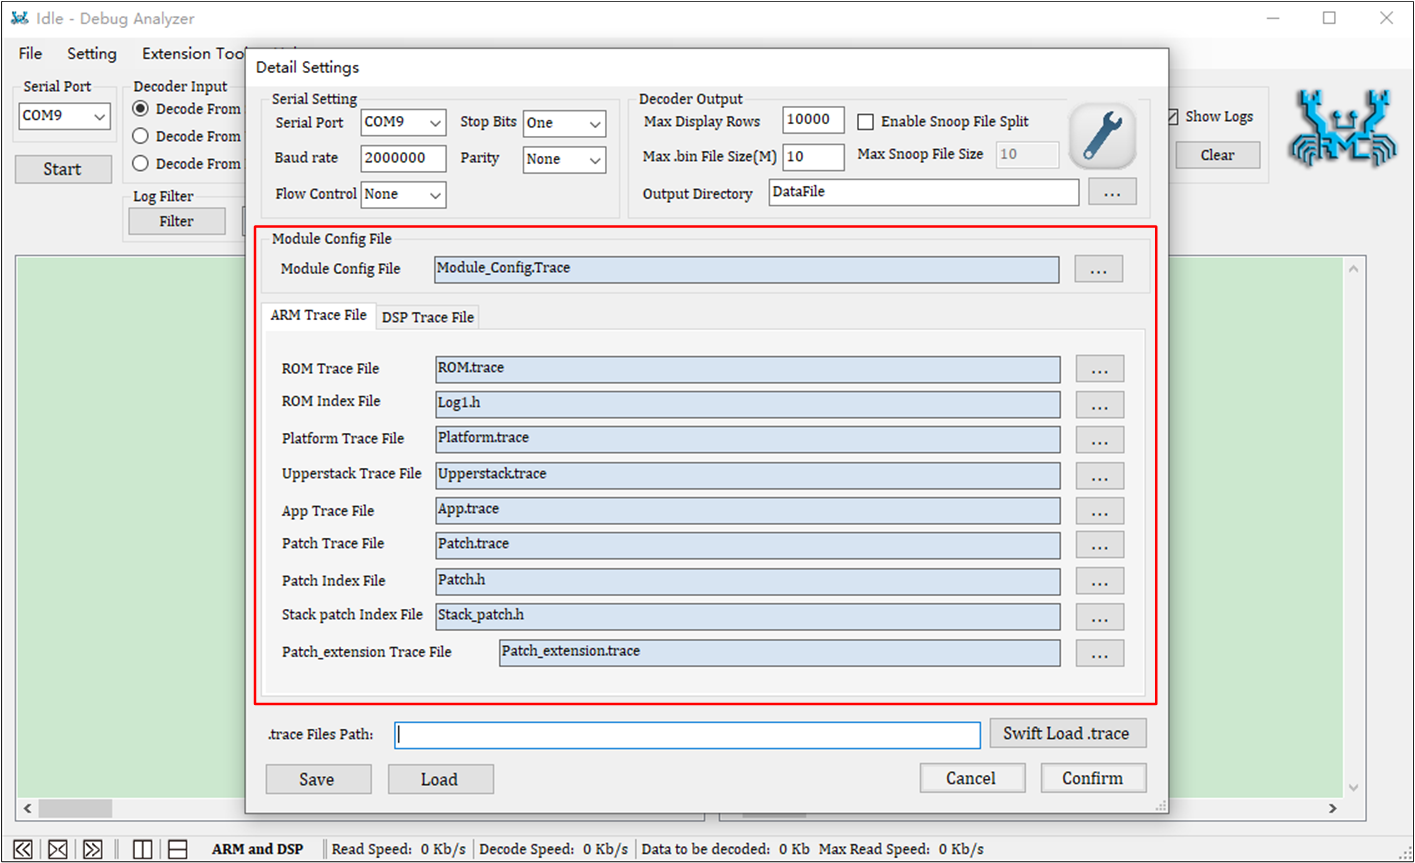
Trace File Path Settings
The following table describes the specific meaning of each option in the Trace File Path part.
Area |
Setting |
Description |
|---|---|---|
Trace File Path |
Module Config File Path |
Set the path for the dependencies file ( Description: The |
ARM Trace File Path |
Set the Note: The |
|
DSP Trace File Path |
Set the Note: The |
Swift Load .trace Files
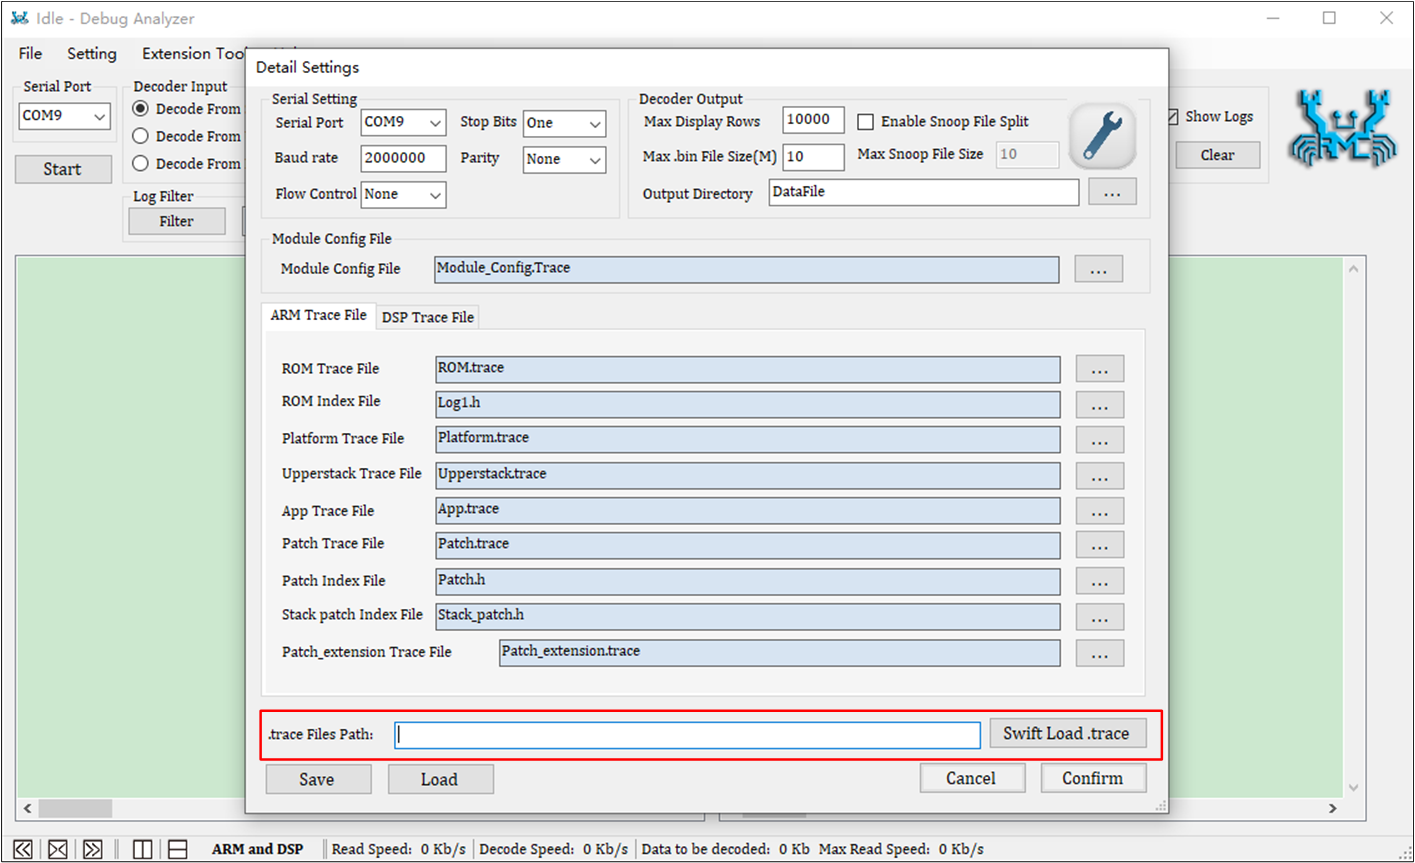
Swift Load .trace
Area |
Setting |
Description |
|---|---|---|
Swift Load |
|
By placing all the dependent |
Settings of Load/Save and Confirm/Cancel
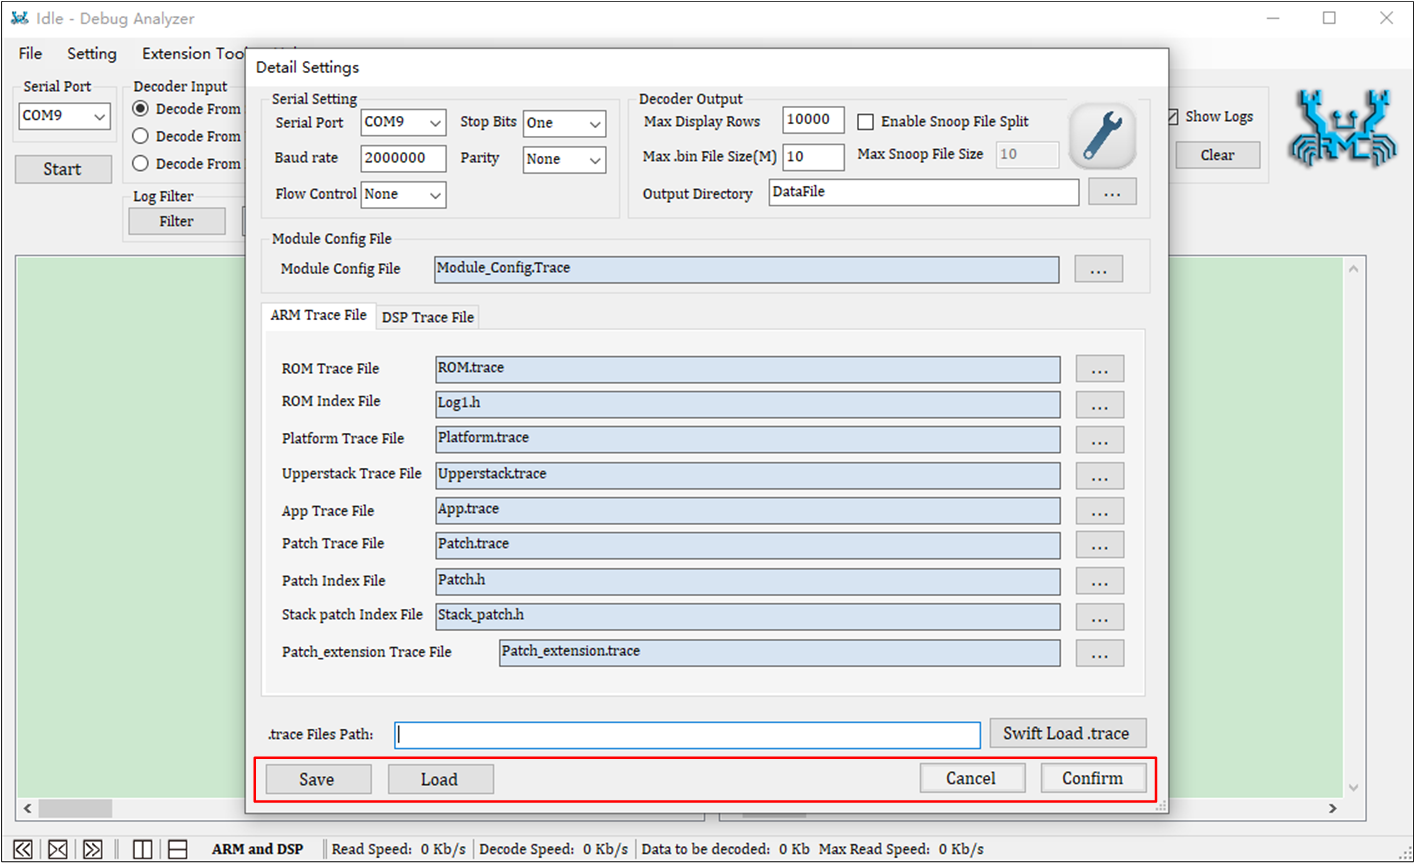
Load/Save and Confirm/Cancel Settings
The following table describes the specific meaning of each button in the Load/Save and Confirm/Cancel Settings part.
Area |
Setting |
Description |
|---|---|---|
Load and Save Settings |
Save |
Save all configurations of the current page to the |
Load |
Load configuration items from the |
|
Confirm and Cancel Settings |
Confirm |
Apply all settings for the current page. |
Cancel |
Cancel the settings of the current page and restore the previous settings. |
Start and Stop Capturing and Decoding
-
Decode From Serial
Before clicking the Start button, please select the correct serial port, and set the correct serial port parameters and
.tracefile (refer to Settings of Detail Settings Dialog). Then click the Start button to start receiving and parsing data.To stop parsing, click the Stop button.
-
Decode From File
Before clicking the Start button, please set the correct
.tracefile. Then click the Start button, select the.binfile that needs to be reversed, and start parsing. Multiple.binfiles can be selected at one time.After parsing all
.binfiles, it will stop automatically.
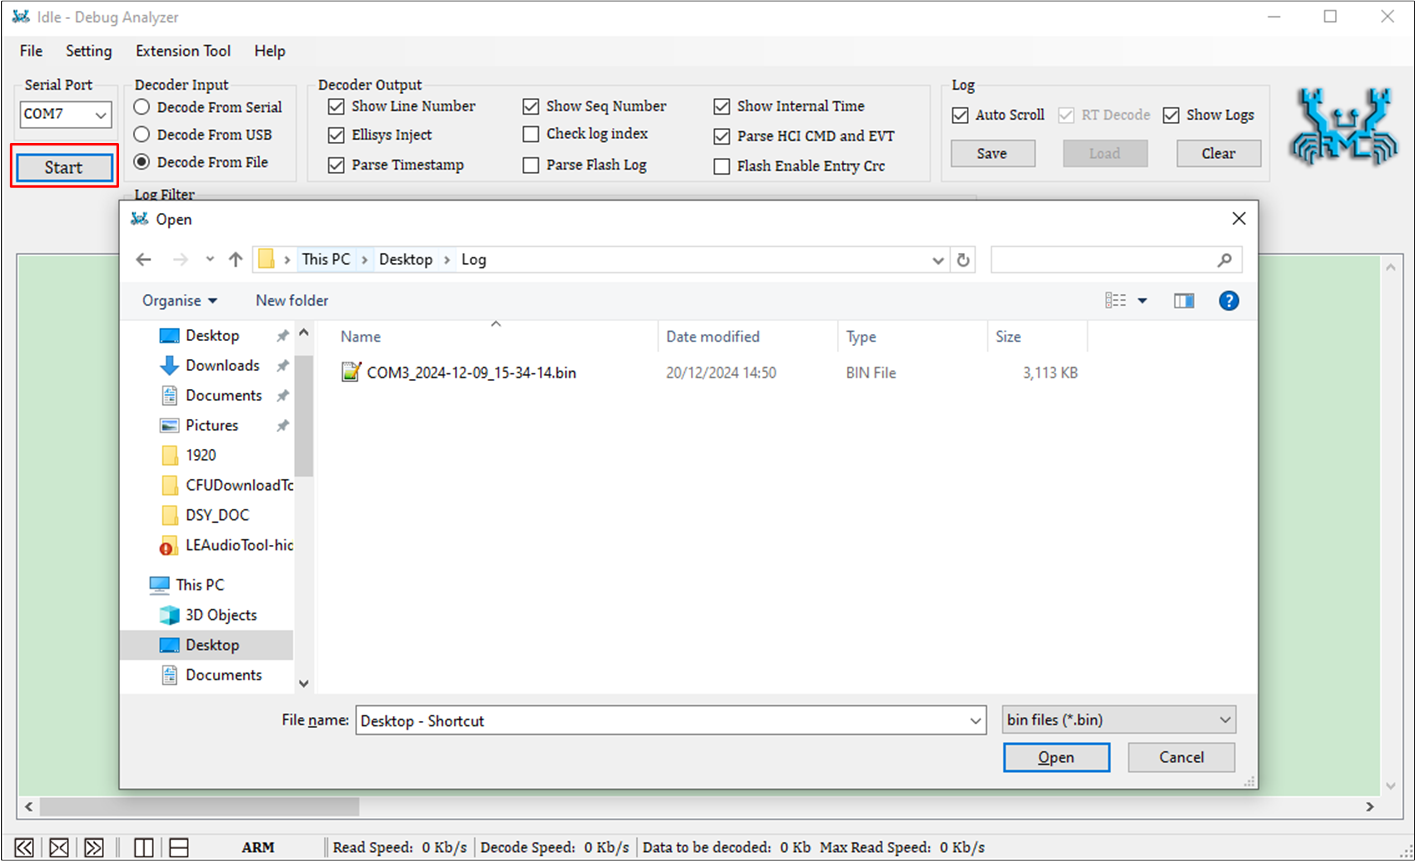
Select Bin File
Log Operation and Display on UI
Log Operation on UI
Users can copy, search and filter the logs shown on UI.
Copy Logs
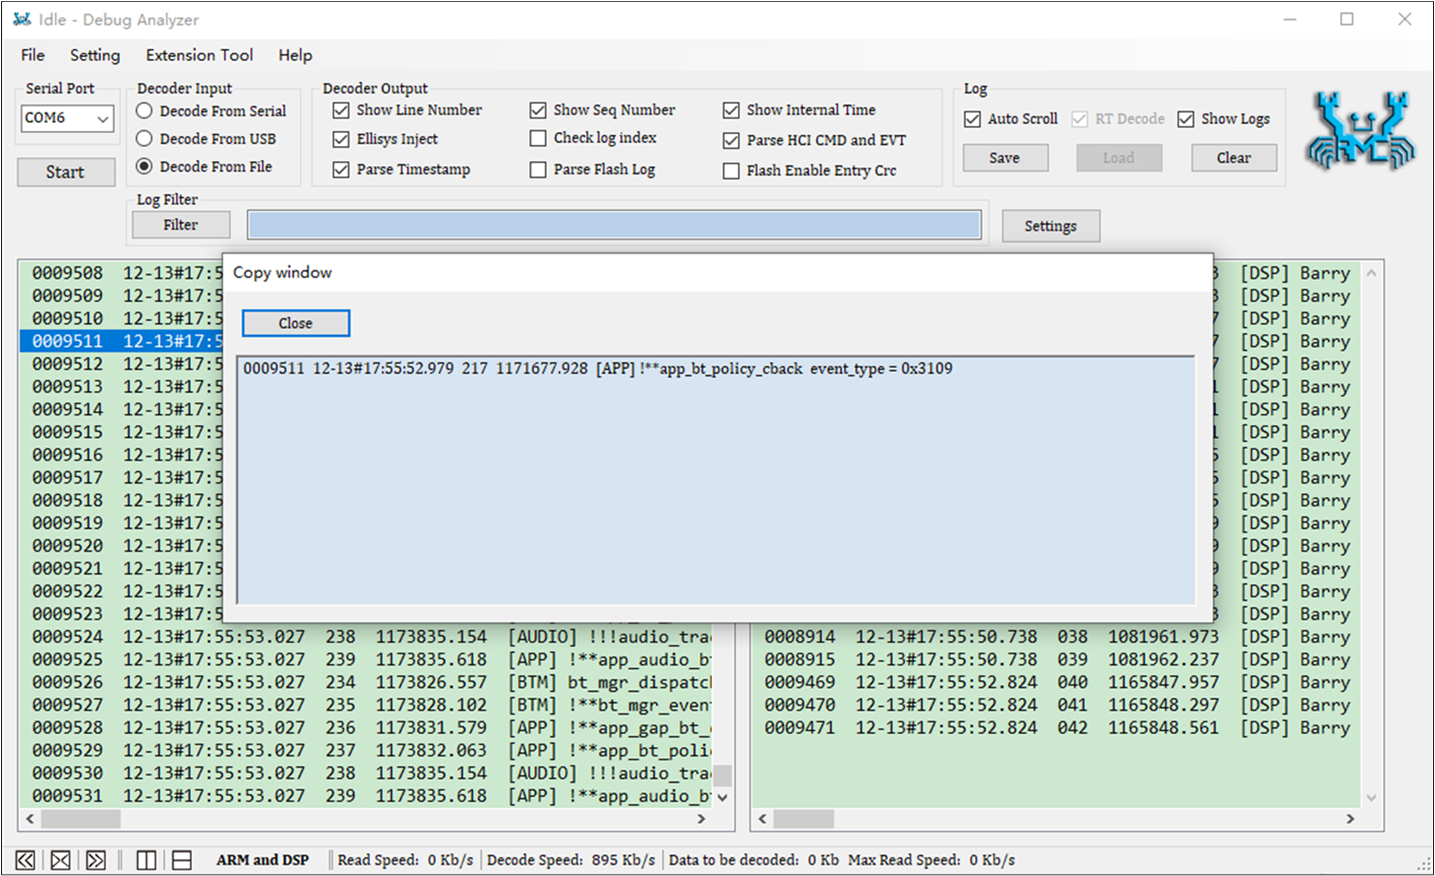
As shown in Copy Logs, select the logs to be copied. Then press Ctrl+C to copy them.
Copy Logs
Show Details of One Log
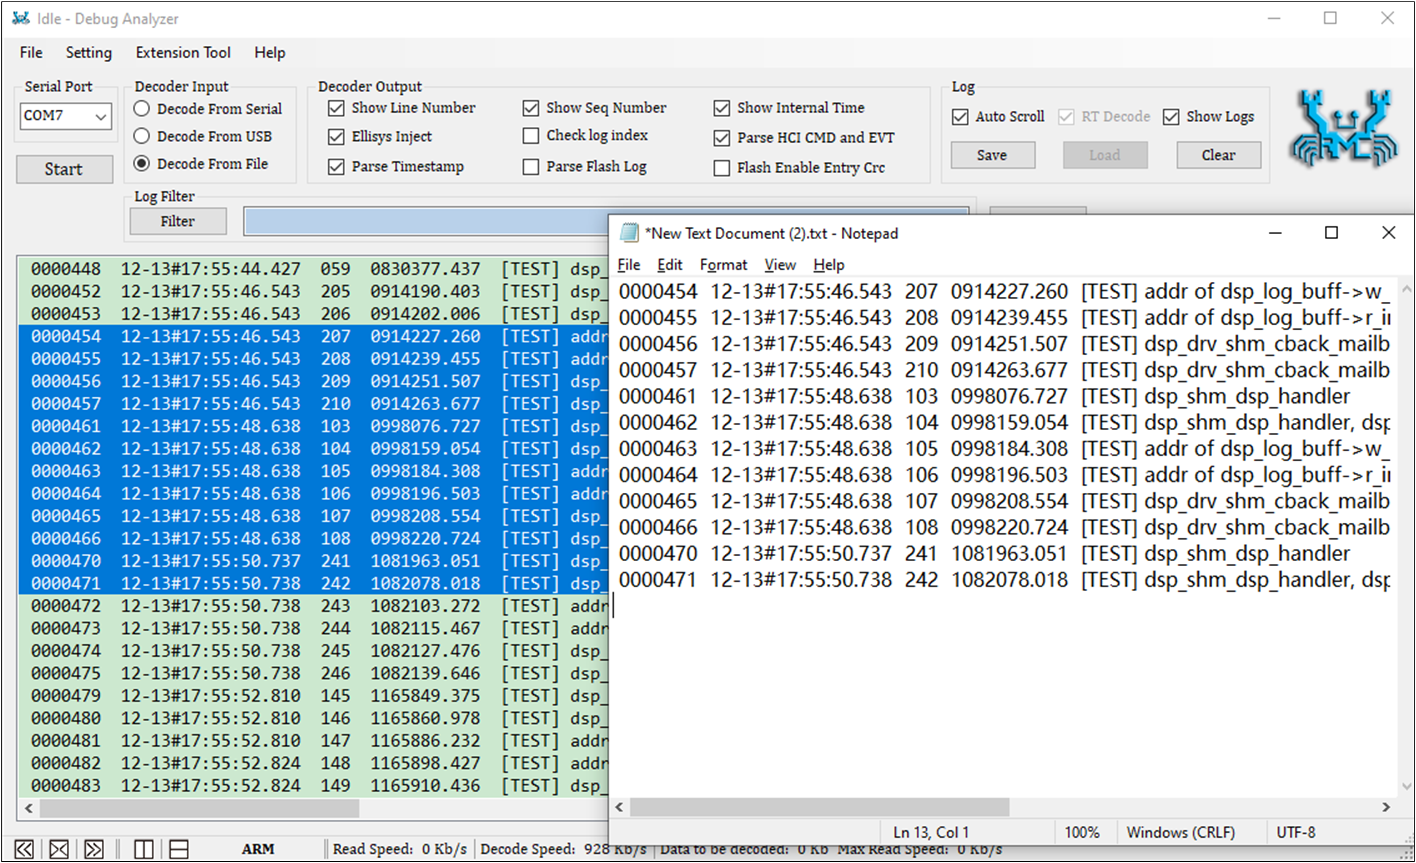
Double click on a log, and a dialog box will pop up to show the details of the log, as shown in Show Log Details .
Show Log Details
Search and Filter Logs
Enter the keyword in the edit column of the filter.
Click the Filter button or press the Enter key on the keyboard, the filter result will be shown as in Search and Filter Logs.
Double click on one log from the Log Filter dialog, which will locate the log in the main dialog.
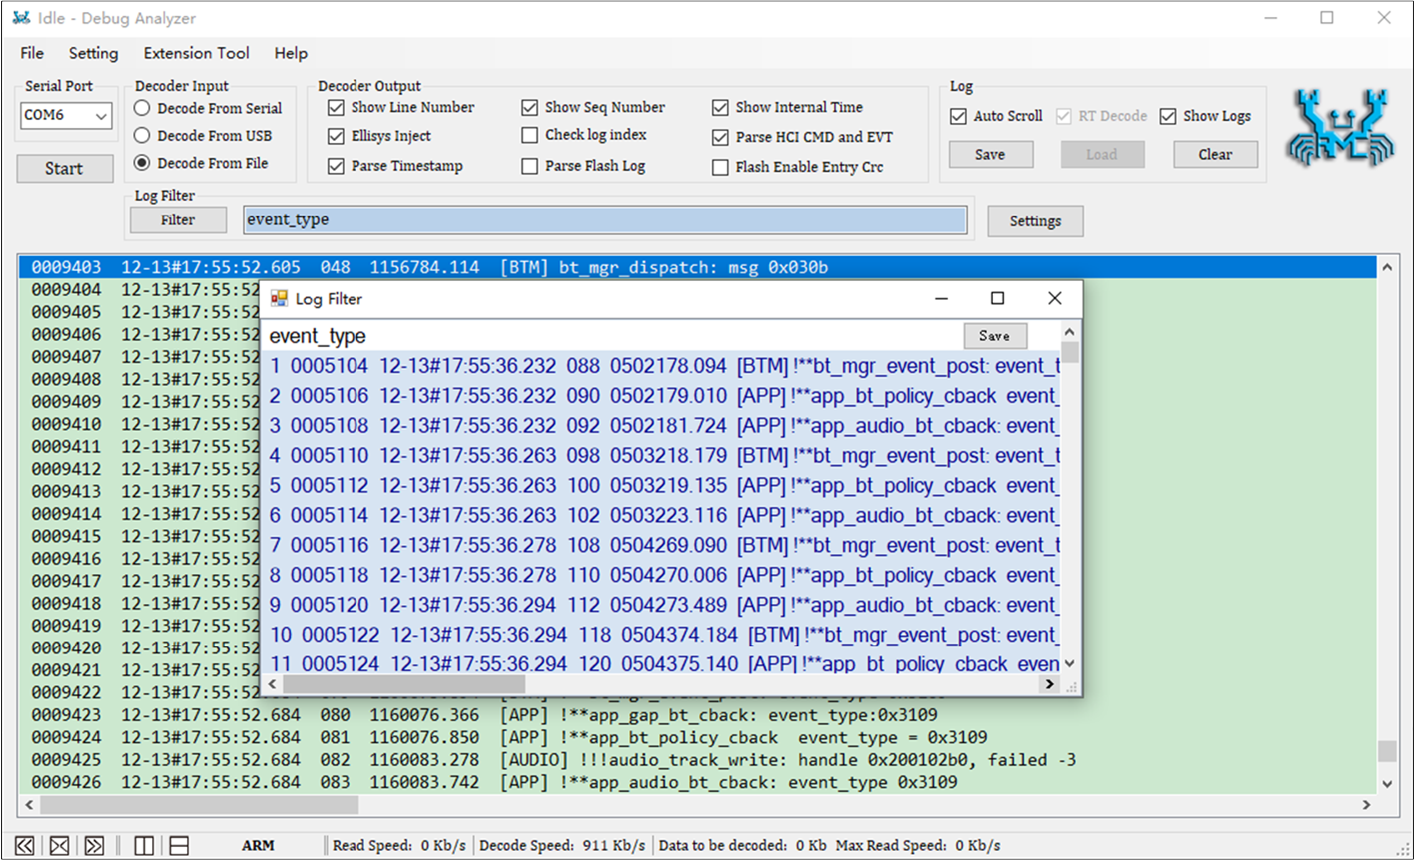
Search and Filter Logs
Click the Button 'Save' to Save Logs
Click the Save button (Save Button). Please note, this operation only
saves all Logs displayed in the main window in the .log file. It
excludes Logs that exceed the maximum number of displayed lines
(which have been emptied).
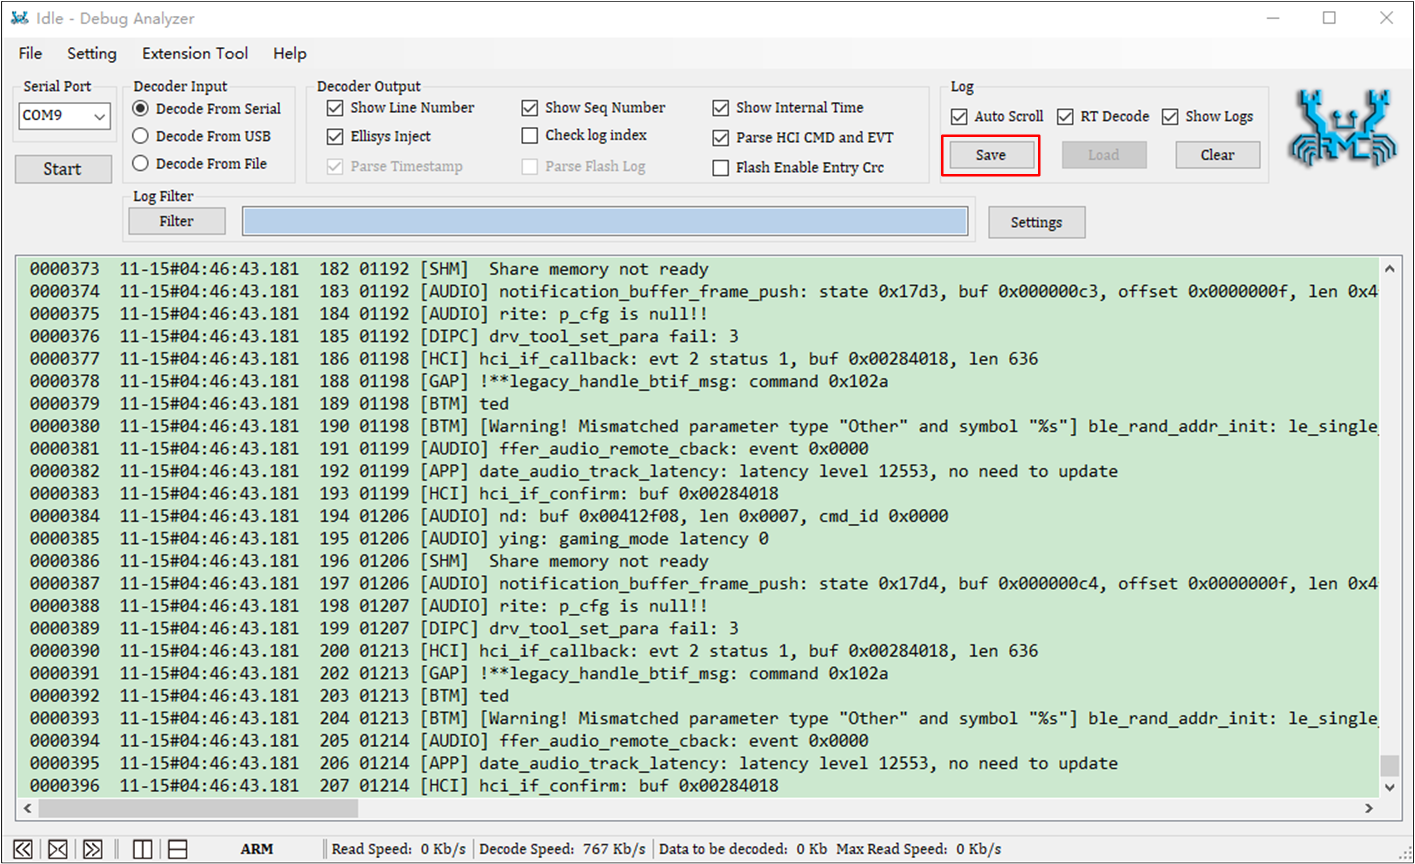
Save Button
Log Display on UI
ARM and DSP Logs can be displayed in left and right/upper and lower columns, as shown in Show ARM and DSP Logs Left and Right and Show ARM and DSP Logs Up and Down.
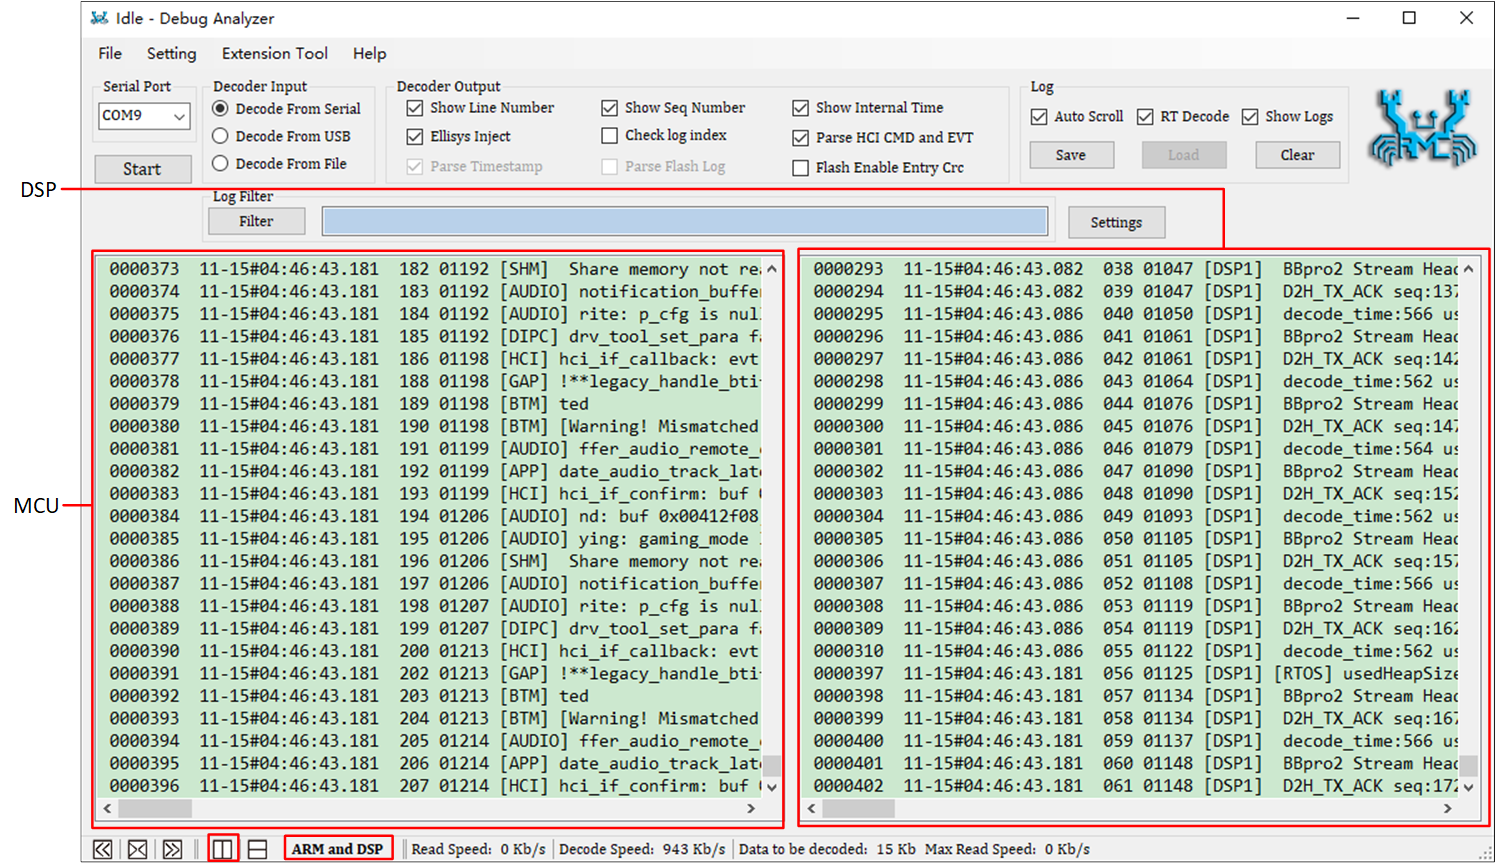
Show ARM and DSP Logs Left and Right
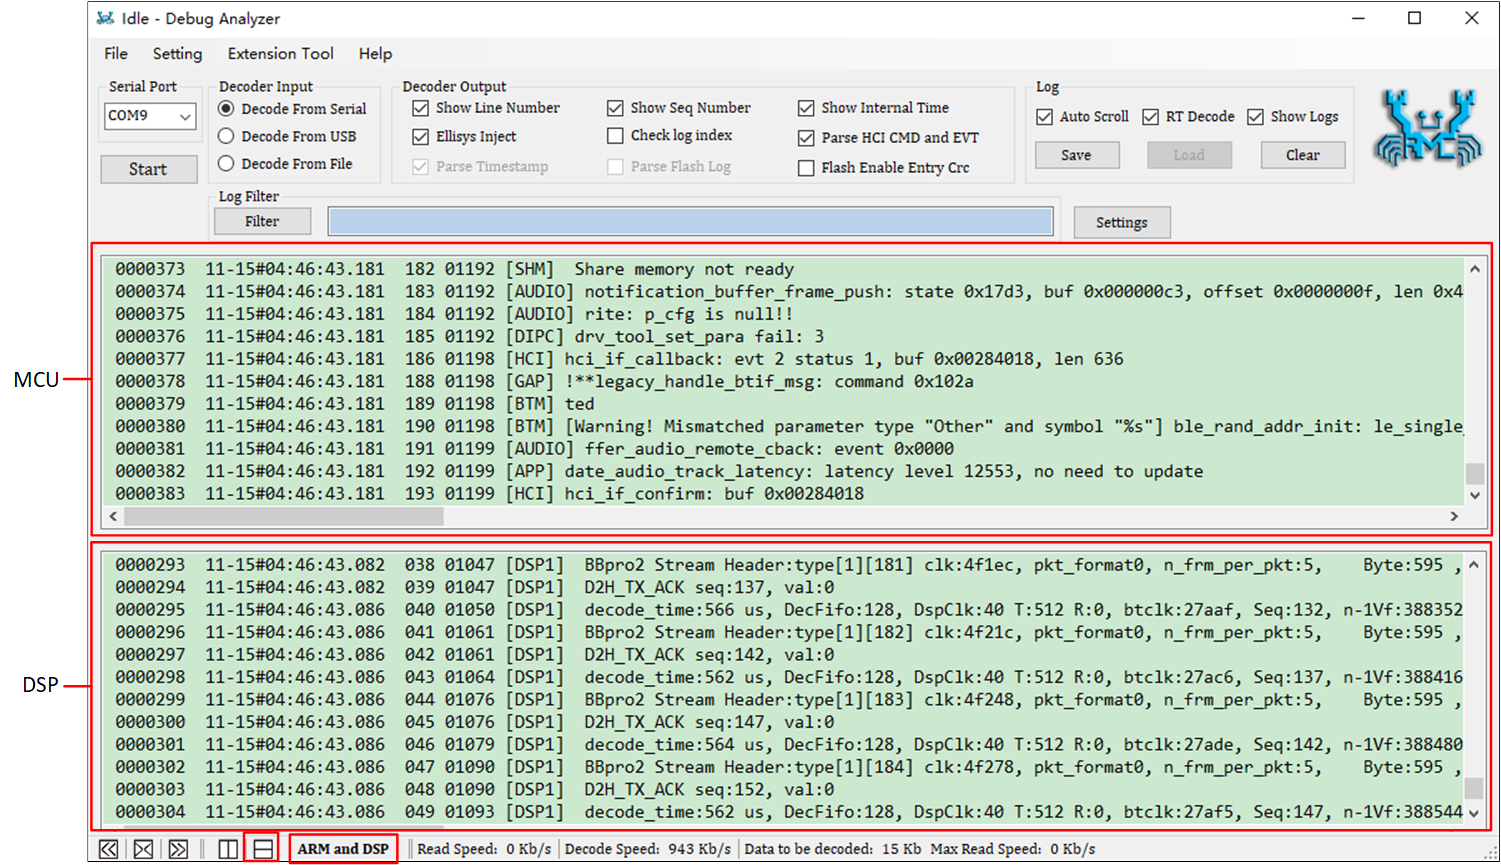
Show ARM and DSP Logs Up and Down
If only focusing on the ARM Logs, it is possible to fold the DSP Logs display area, as shown in Show ARM Logs Only (DSP Logs Folded).
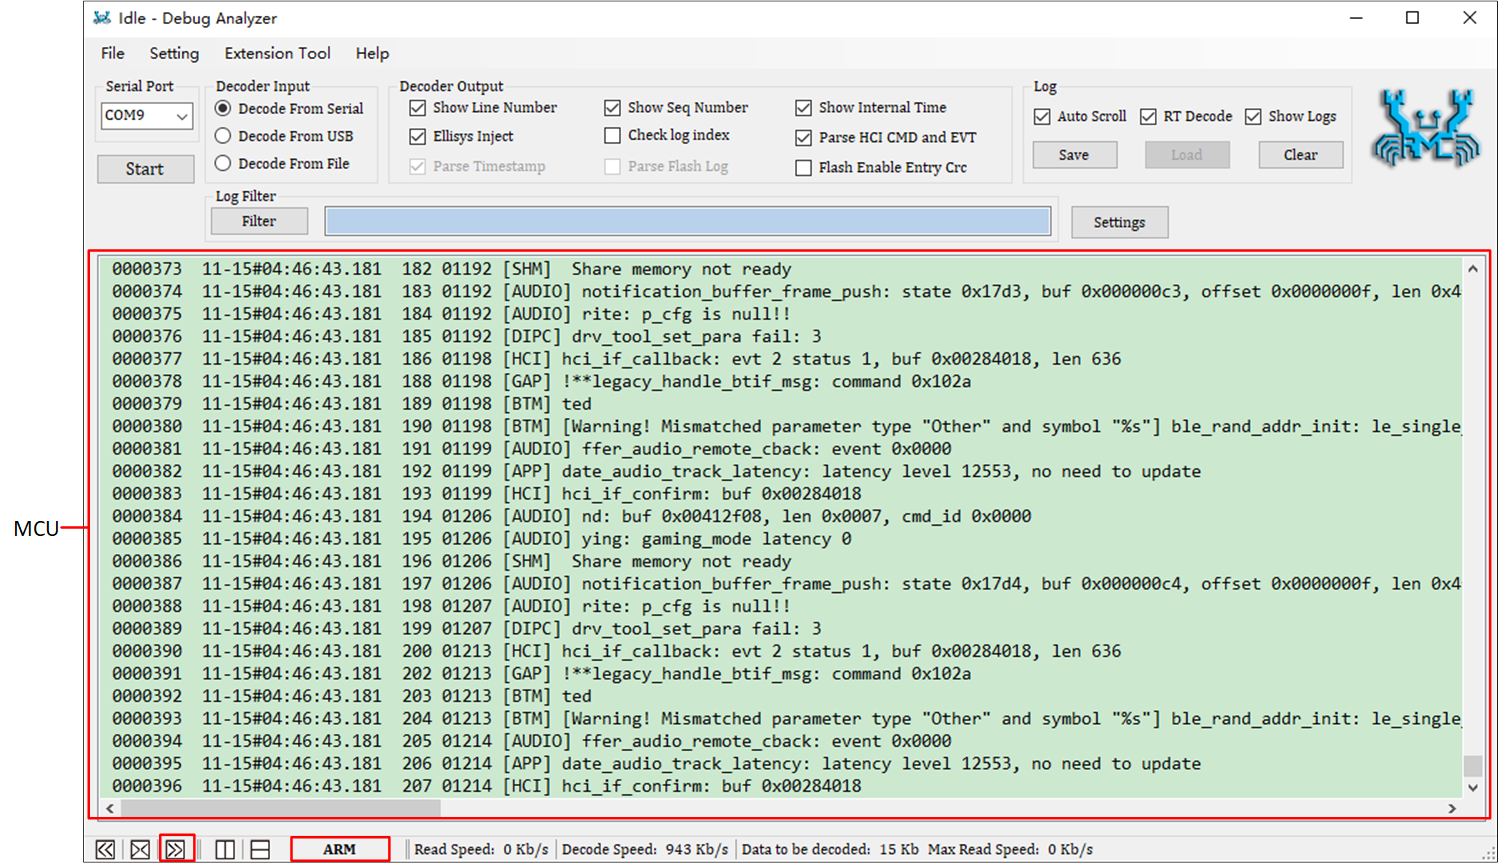
Show ARM Logs Only (DSP Logs Folded)
If only focusing on DSP Logs, fold the ARM Log display area, as shown in Show DSP Logs Only (ARM Logs Folded).
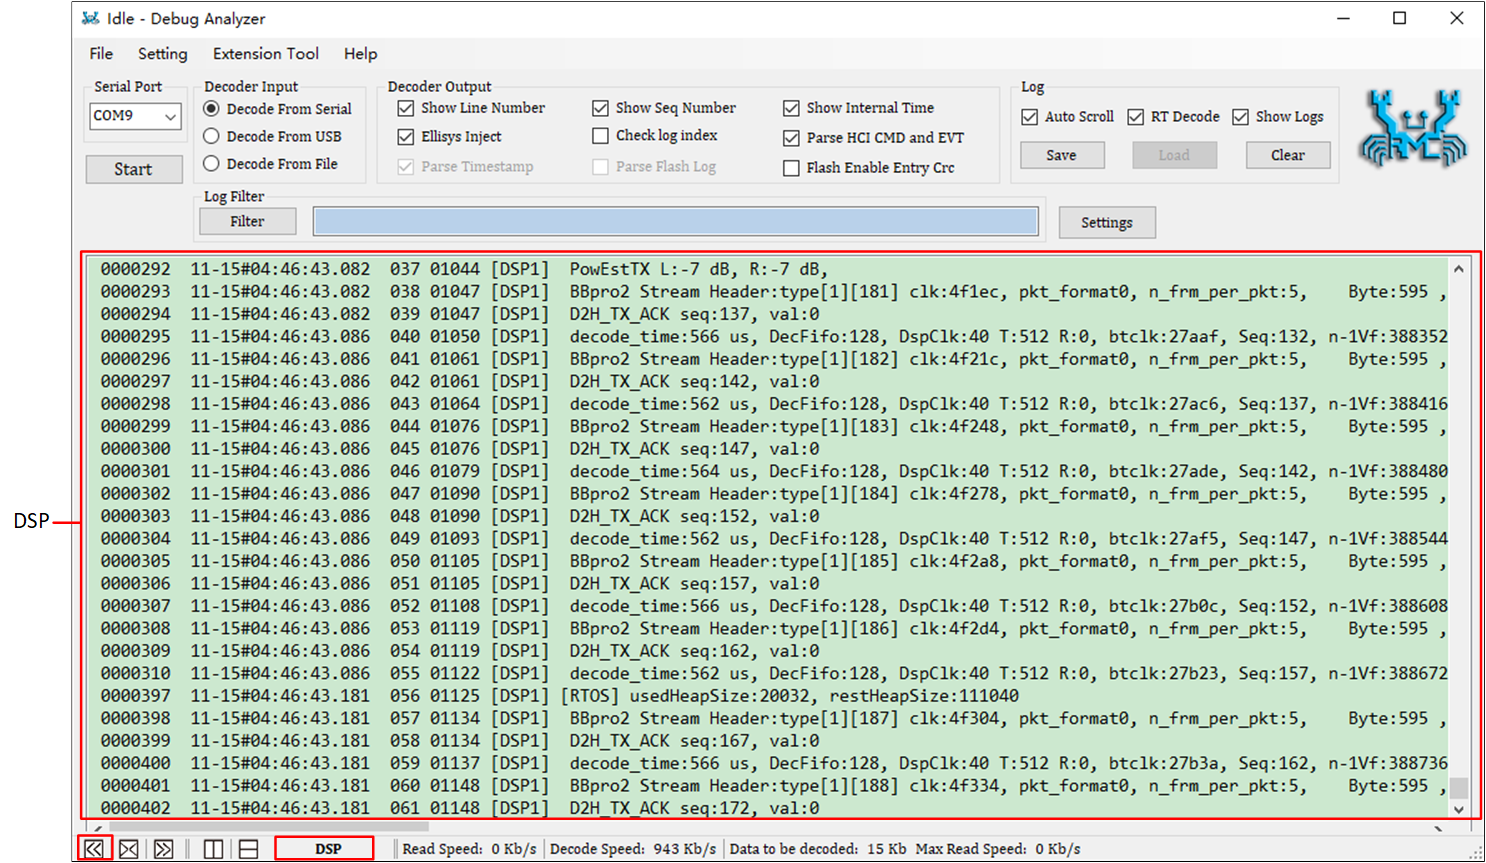
Show DSP Logs Only (ARM Logs Folded)
How to Use Ellisys View Package of BTSnoop
Real-time Display of BTSnoop Log
Debug Analyzer supports sending BTSnoop Log to Ellisys to display HCI layer command/event interaction in real time. The use steps are as follows.
To use this feature, users need to click from the menu bar to open the Decoder Output Settings page and check both the Save Snoop File and Ellisys Inject checkboxes.
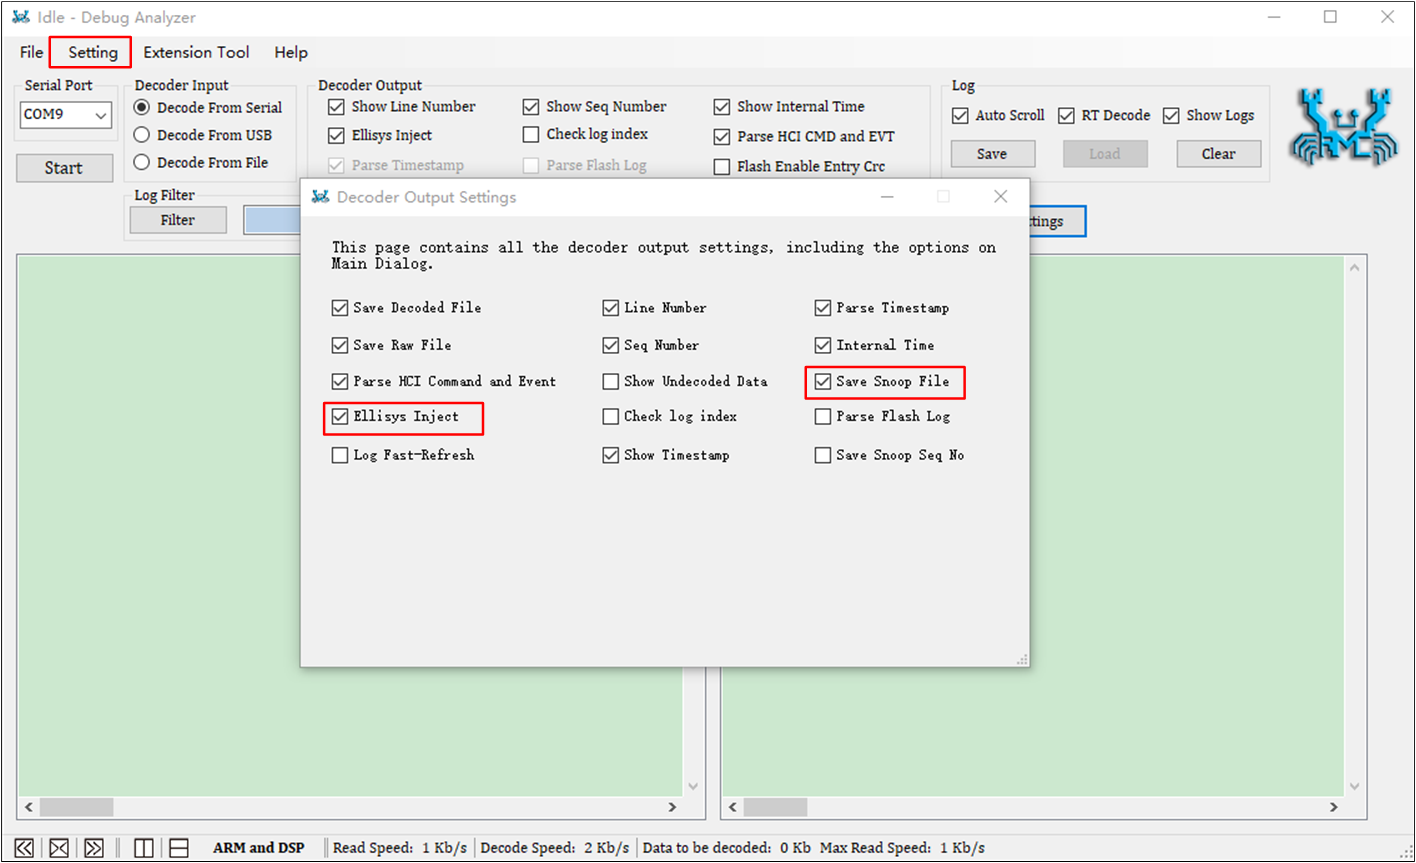
Decode Output Settings
Open Ellisys, as shown in Ellisys Configure , click Configure ... to confirm that the Classic Bluetooth and Bluetooth Low Energy options are selected for the first time.
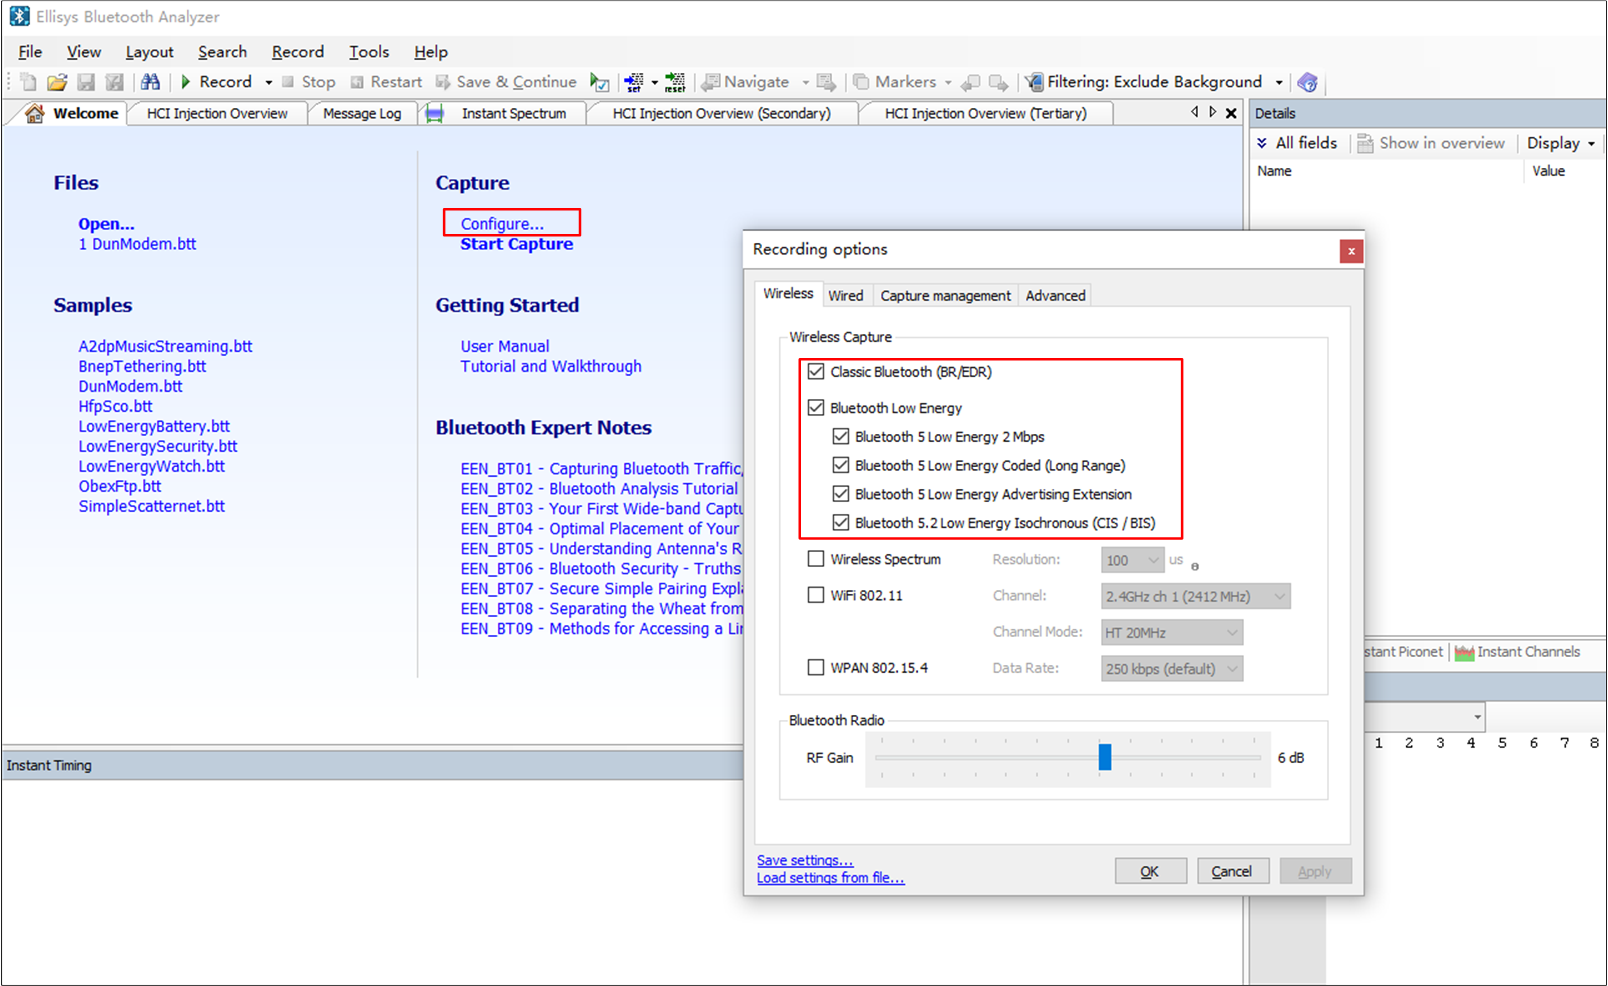
Ellisys Configure
As shown in Injection API Setting , click in the menu bar, switch to the Injection API tab, and check the following options.
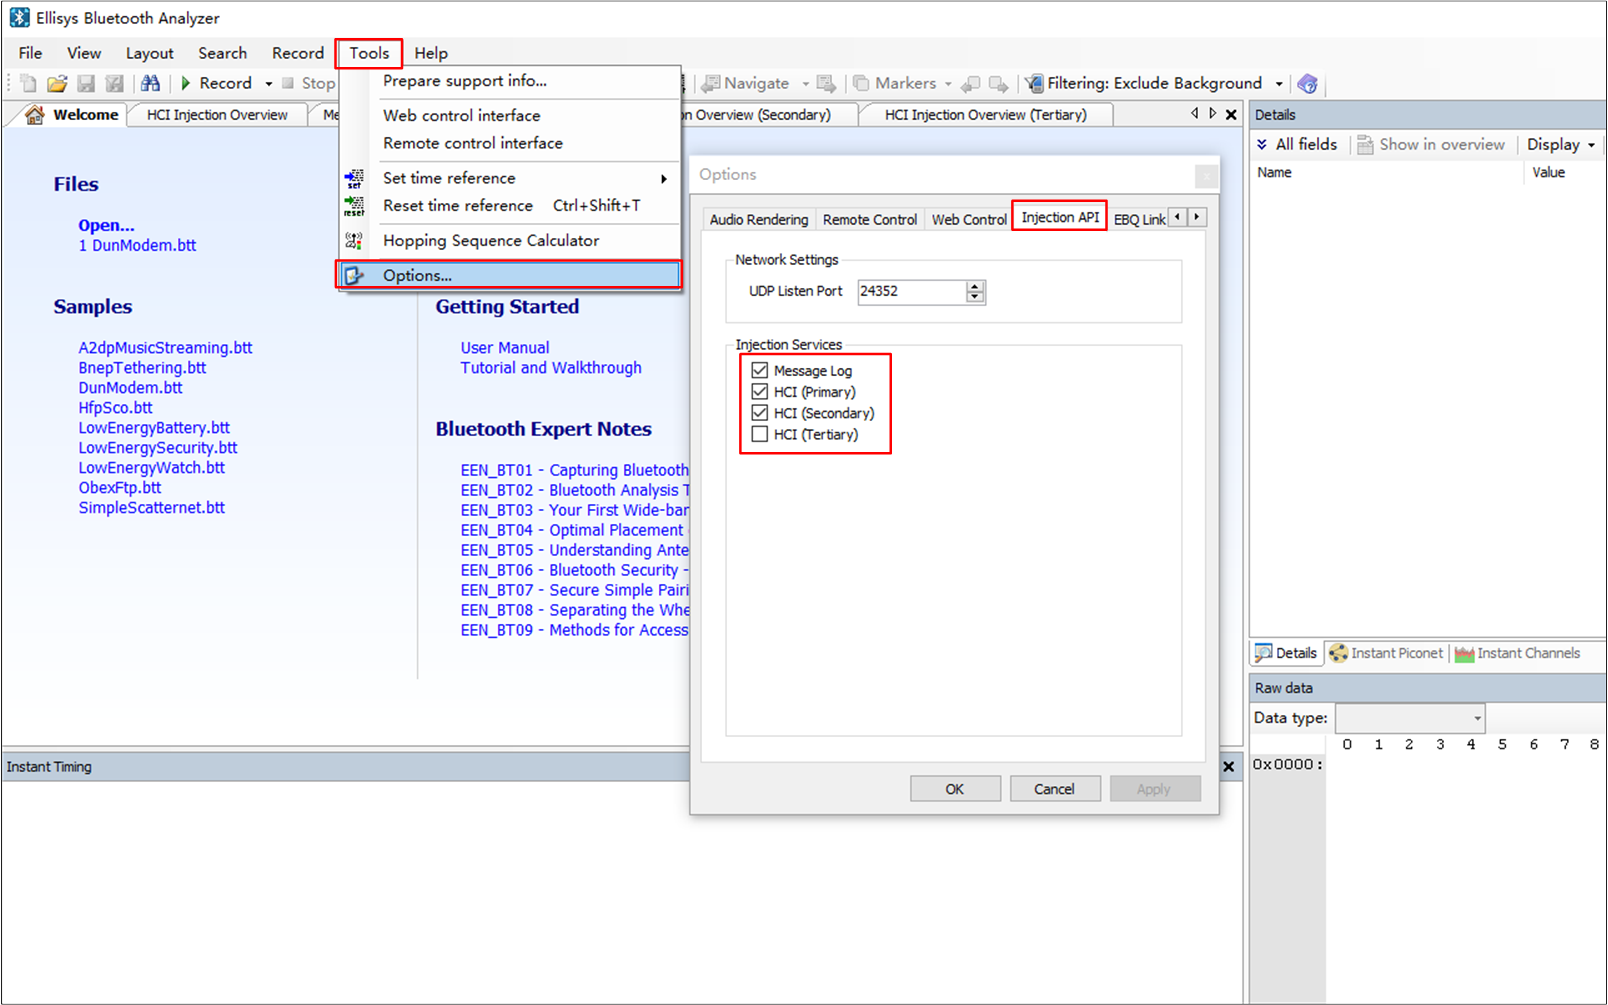
Injection API Setting
After clicking the Start button on Debug Analyzer to record logs, click the Start Capture button to start capturing packets.
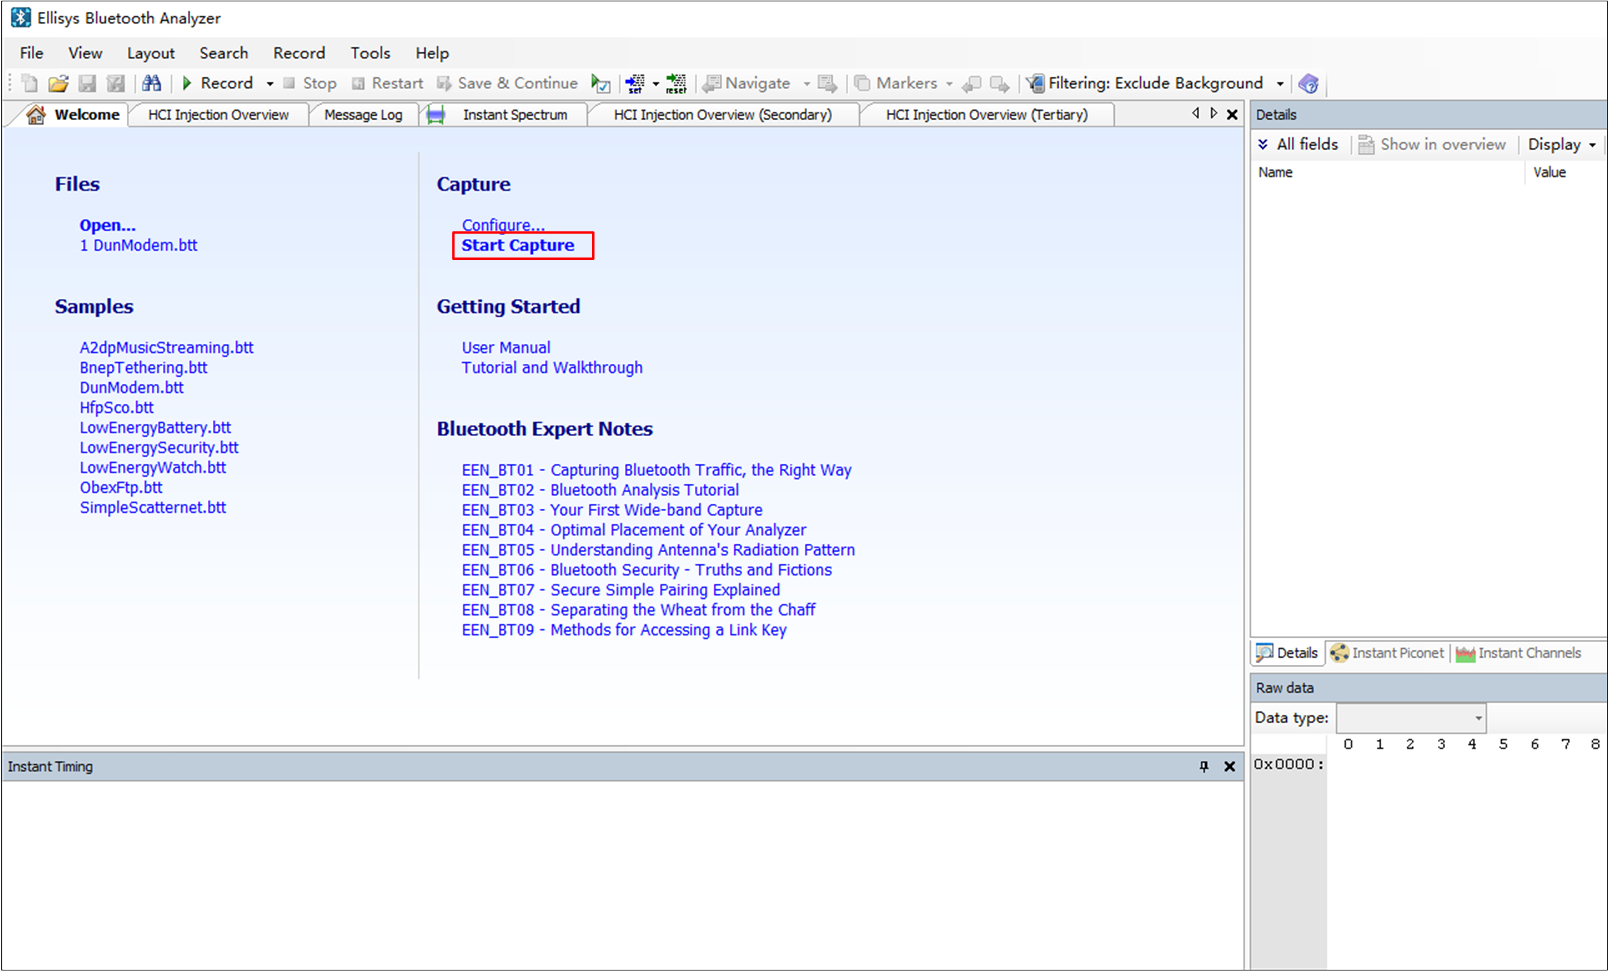
Start Capture
-
Open HCI injection.
Check , as shown in Open HCI Injection Overview.
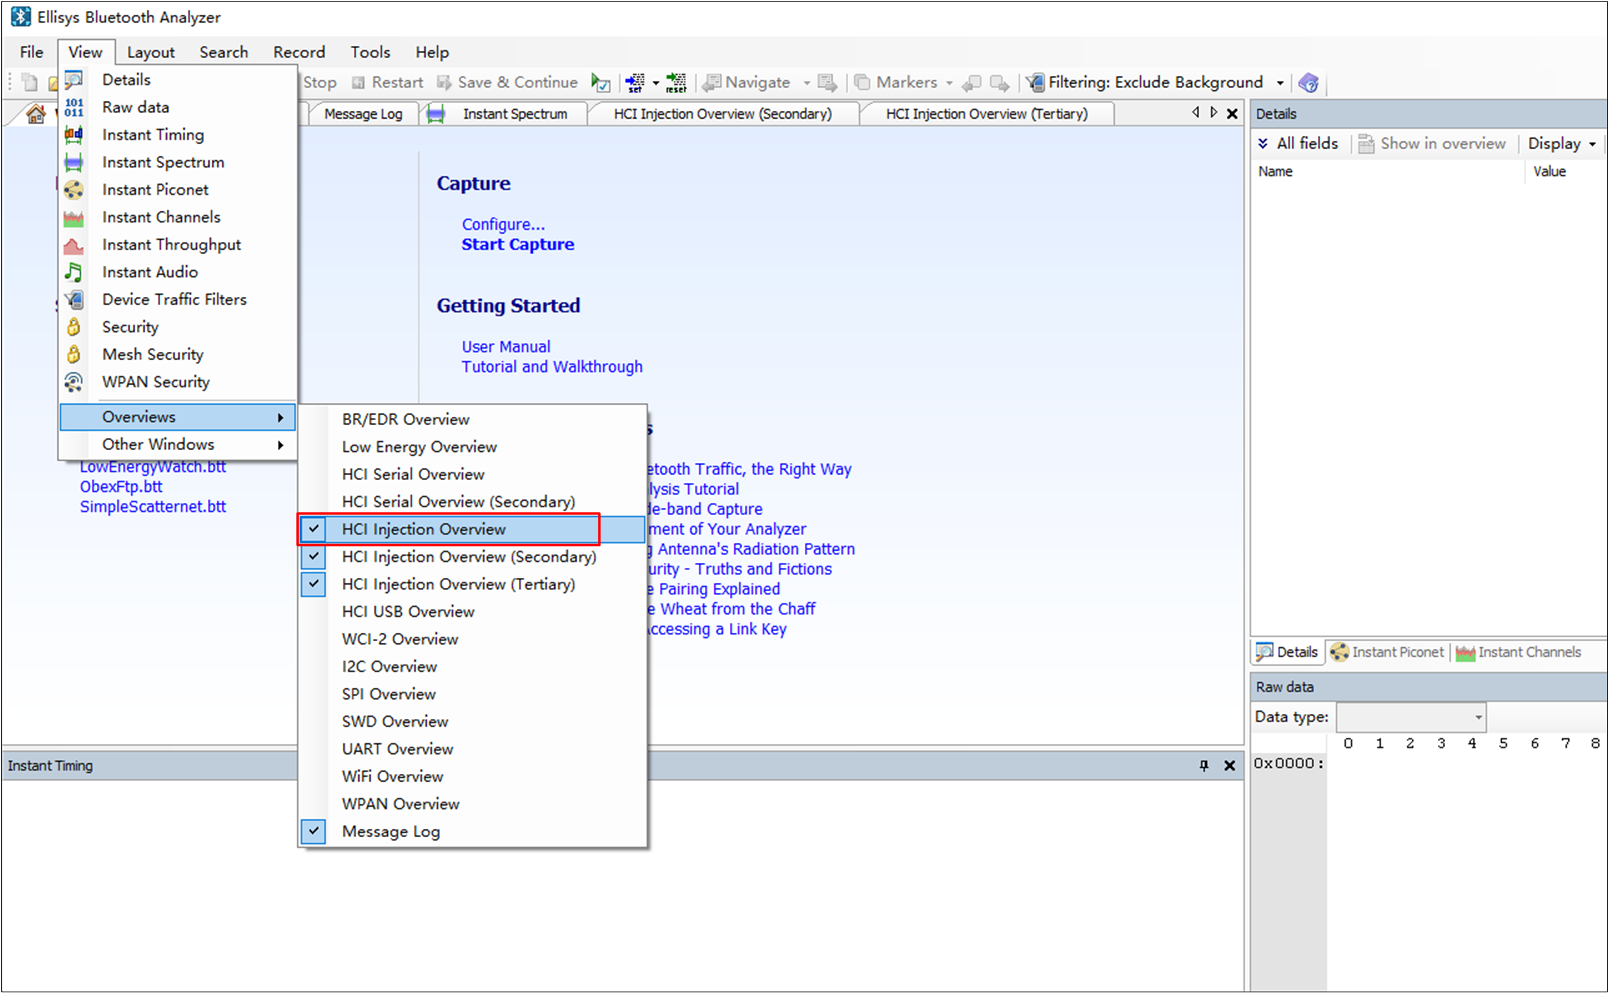
Open HCI Injection Overview
The packages of BTSnoop caught by the Debug Analyzer are displayed in real time on the HCI Injection Overview dialog. HCI Injection Overview shows the contents after SoC has been reset.
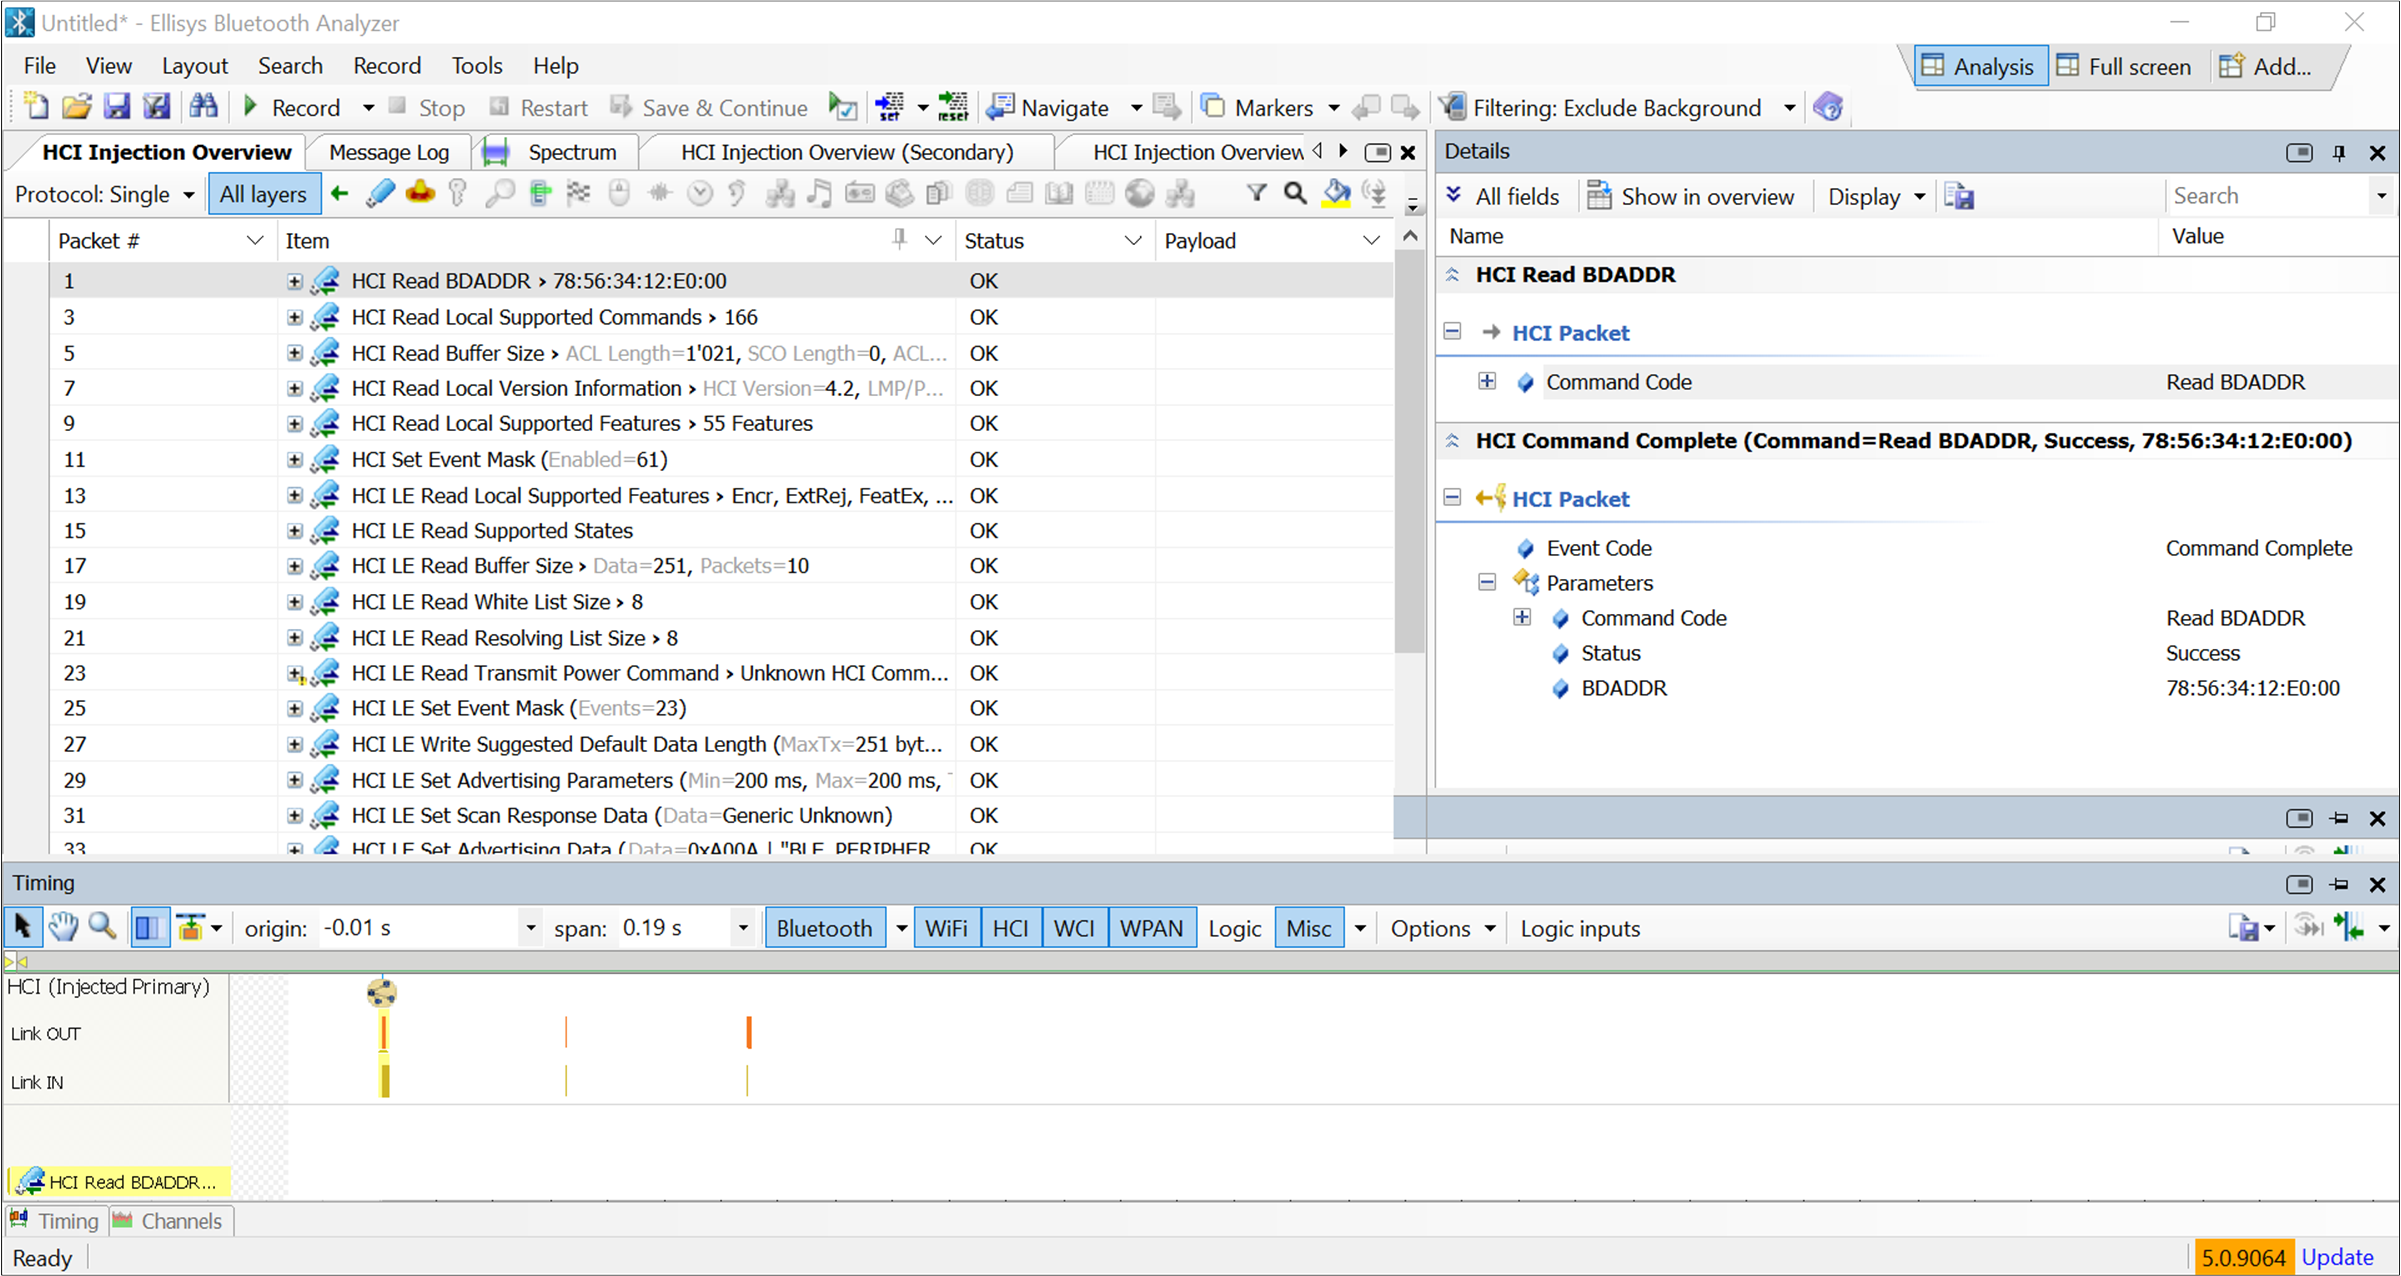
HCI Injection Overview
Notes for Using Ellisys to View BTSnoop
Ellisys does not affect the decoding state of Debug Analyzer. For example, Debug Analyzer remains in the decoding state even if Ellisys is turned off or opened.
The Ellisys air sniffer and HCI injection can be used simultaneously.
Running multiple instances of the Debug Analyzer tool on one PC is not recommended, as HCI injection data may get mixed together.
The Ellisys function is only used to view HCI layer packages.
Extended Usage
Coredump Parser
Debug Analyzer supports parsing Coredump.
To use Coredump Parser page, select from the menu bar.
Note
Coredump Parsing is only supported for IC Types RTL87x3E, RTL87x3D and RTL87x3EP.
To use the Coredump Parser, make sure that the ROM Trace File item on the Trace File Path Settings is correctly configured before recording logs via Debug Analyzer.
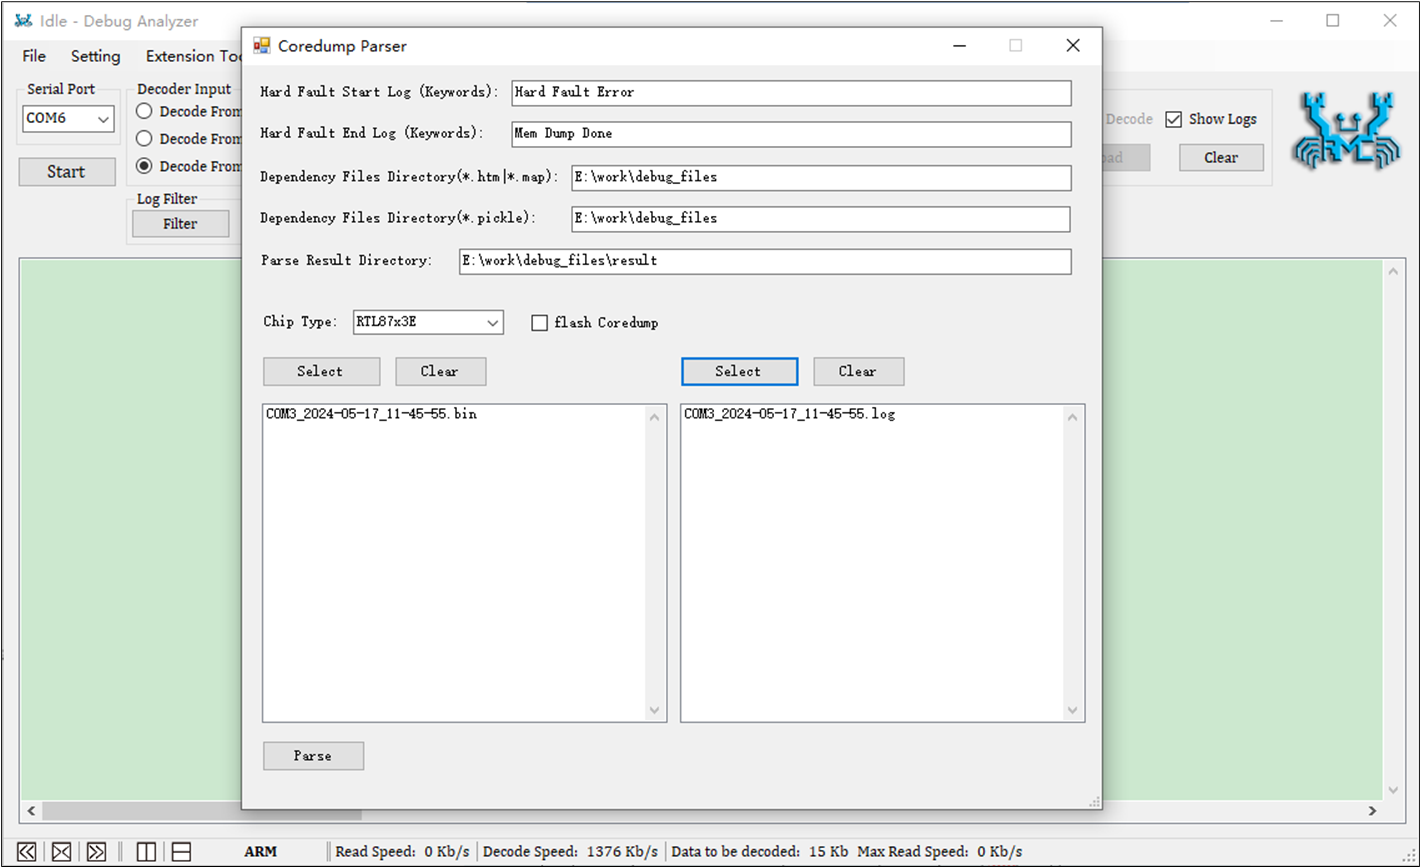
Coredump Parse
The following table describes the specific meaning of each option in the Coredump Parser part.
Option |
Selection |
Description |
|---|---|---|
Core Dump |
Hard Fault Start Log (Keywords) |
The keyword for the hard fault information start log in the Specific keywords can be found in Table 8-2: Hard Fault Keywords. |
|
Hard Fault End Log (Keywords) |
The keyword for the hard fault information end log in the Specific keywords can be found in Table 8-2: Hard Fault Keywords. |
|
Dependency File Directory( |
The path to the dependency files ( |
|
Dependency File Directory( |
The path to the dependency files ( |
|
Parse Result Directory |
The path to save the parsing result. |
|
Chip Type |
RTL87x3E/ RTL87x3D chip type selection. |
|
Flash Coredump |
Used to parse the core dump file read back from flash. After checking, you don't need to fill in Hard Fault Start Log, Hard Fault End Log Keywords, you don't need to select |
|
Select |
Select |
|
Select |
Select |
|
Parse |
Click the button to start parsing, the button will be grayed out after parsing starts, and will be restored after parsing is completed. |
Option |
Type |
Start Log |
End Log |
|---|---|---|---|
Keyword |
Hard Fault |
Hard Fault Error |
RTL87x3E: Mem Dump Done RTL87x3D: Memory Dump Done |
WDT |
RTL87x3E: Watchdog Interrupt RTL87x3D: WDT Interrupt |
RTL87x3E: Mem Dump Done RTL87x3D: Memory Dump Done |
|
Reset |
WDT Reset |
FSBL |
|
Reboot |
PC: 0x######## |
PSR: 0x######## |
Note
If there are multiple exceptions in a log file, you can copy the start log and end log as a whole log line.
Reset: If there is no FSBL, take the first log after WDT Reset.
Reboot: 0x######## is replaced by the specific PC and PSR values at the time of reboot, and this tool will help resolve the PC and LR corresponding to function name and PSR corresponding to interrupt type.
Dependency File Directory (*.htm|*.map) and Dependency File
Directory (*.pickle) are used to set the path of the symbol information
dependency file, which corresponds to the actual running ROM and flash
code symbol information of the system. These two dependency file paths
can be filled in only one or both, but the dependency file type cannot
be duplicated.
Only the Dependency File Directory (*.pickle) path needs to be set.
When both the ROM and flash image dependency files are selected as
*.pickleformat, the path only needs to be set by Dependency File Directory (*.pickle).
Only the Dependency File Directory (*.htm|*.map) path needs to be set.
The debugging APP image dependency file is
*.htm|*.mapformat, and the path is set by Dependency File Directory (*.htm|*.map).
Need to set both paths.
For example, if you select
*.pickleformat for some dependency files (non-APP image type) in ROM and flash image, and select*.htm|*.mapformat for debugging APP image dependency files, you need to set both Dependency File Directory (*.pickle) and Dependency File Directory (*.htm|*.map) path information.
When searching for the dependency file, please pay attention to the symbol file corresponding to the actual running code of the system, only the one corresponding to the actual running of the same type of symbol file can be selected, and the same type of file of bank0 and bank1 cannot be selected at the same time.
The RTL87x3E symbol information file includes ROM symbols, common image symbols and bank flash code image symbol files, taking the pickle file as an example, and the following symbol files can be collected on bank0:
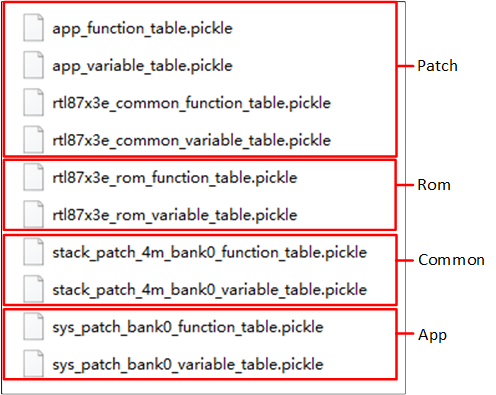
RTL87x3E Symbol Information
RTL87x3D symbol information file includes ROM symbol and bank flash code image symbol file, taking pickle file as an example, the following symbol files can be collected for bank0:
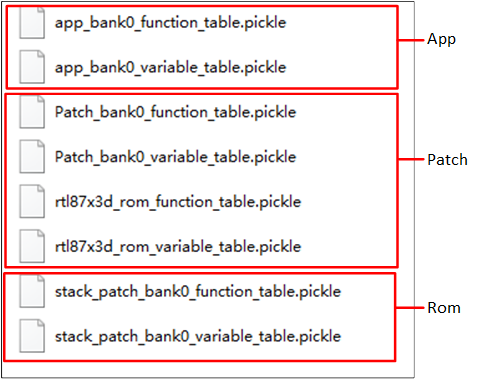
RTL87x3D Symbol Information
Rename Title of Debug Analyzer
In many cases, such as capturing log of RWS Headsets, users would start two Debug Analyzer Tools. Then rename the two to different titles (e.g. Left and Right) is distinguishable and helpful.
Instructions:
Click (Rename Title ), there are 5 options, and please select the new title.
Debug Analyzer
Left-Debug Analyzer
Right-Debug Analyzer
Primary-Debug Analyzer
Secondary-Debug Analyzer
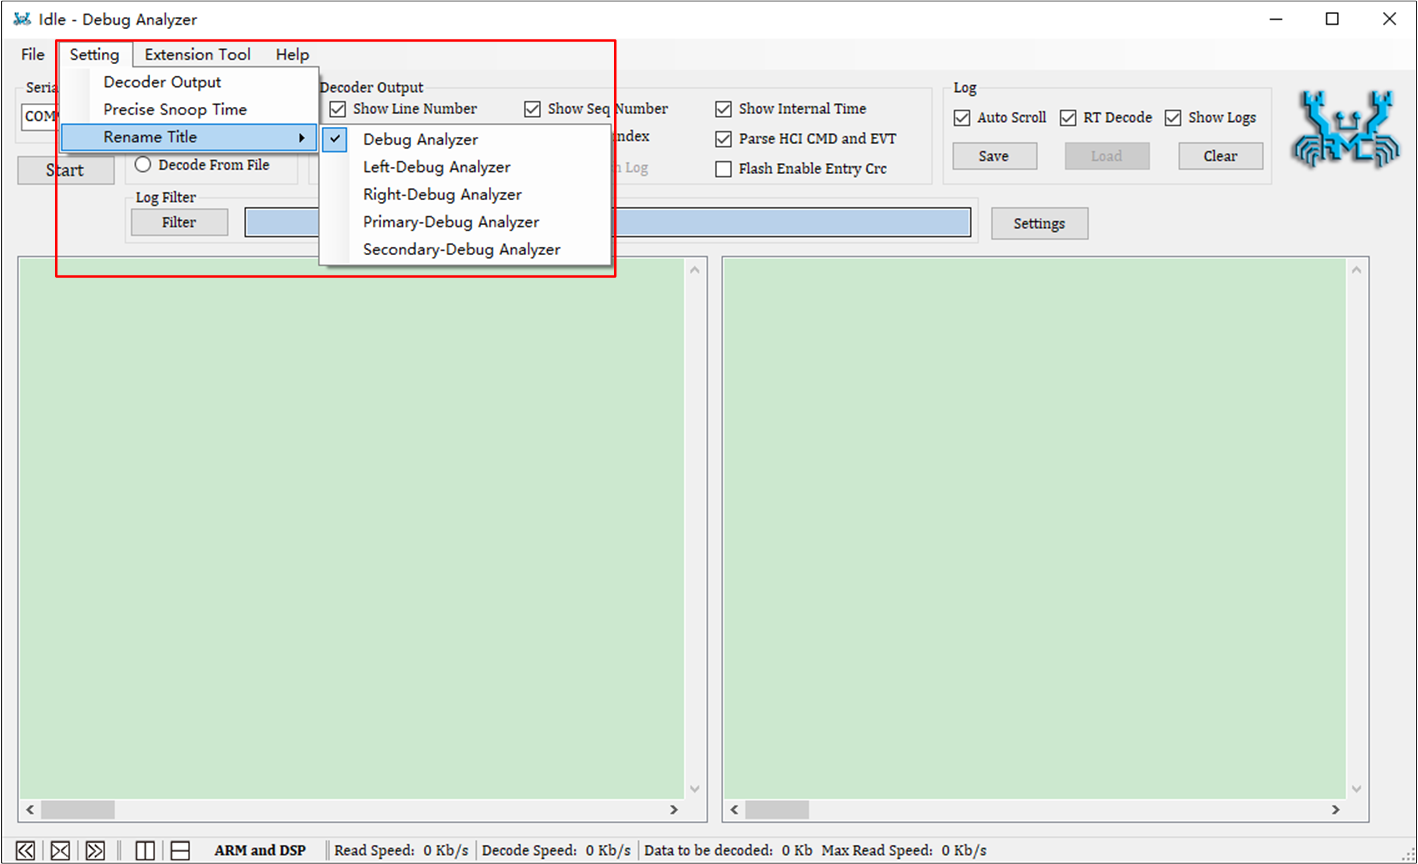
Rename Title
View Version of Debug Analyzer
View Method:
Click Help on Menu Bar and select About DebugAnalyzer.
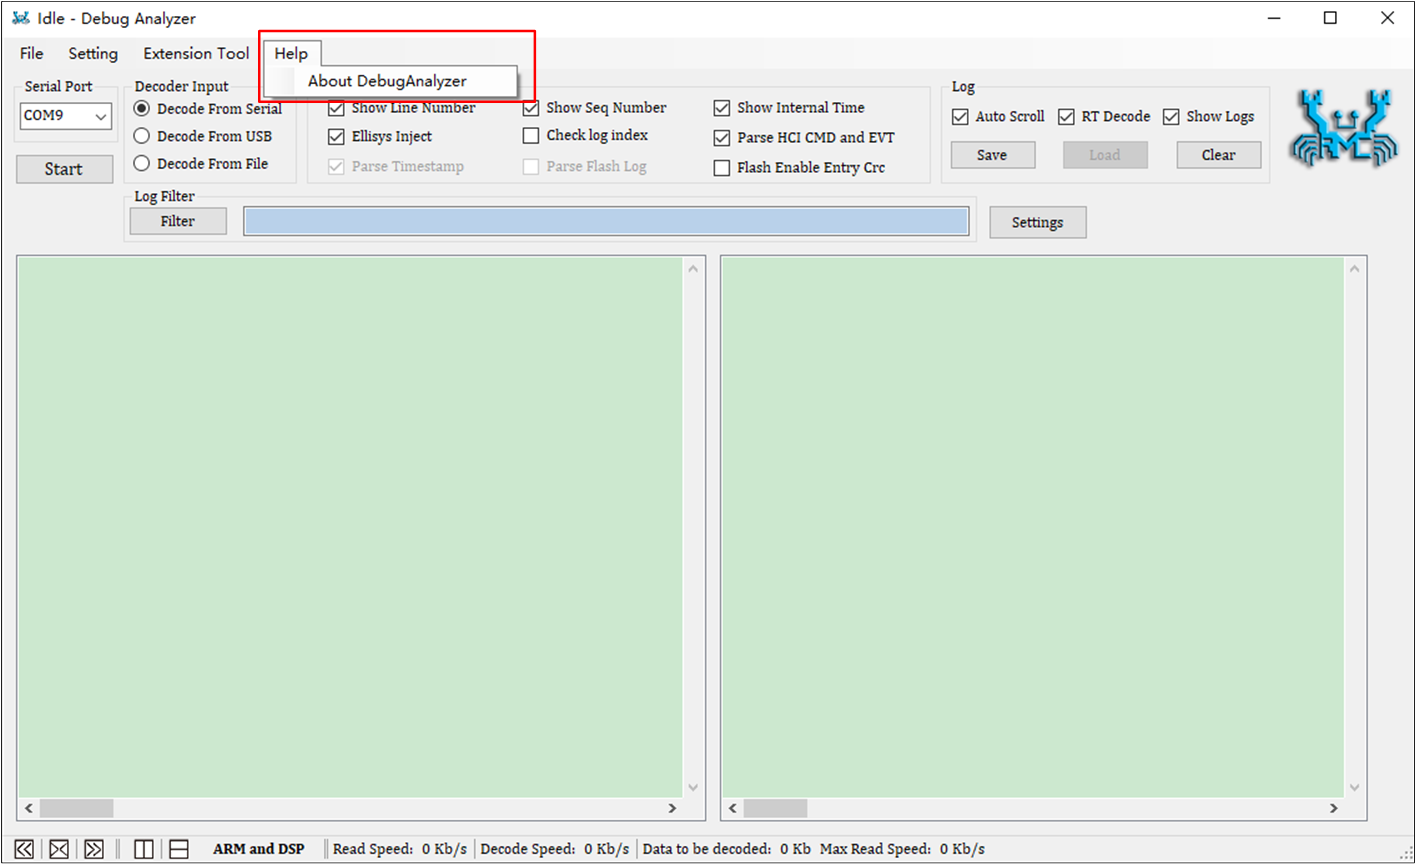
About DebugAnalyzer
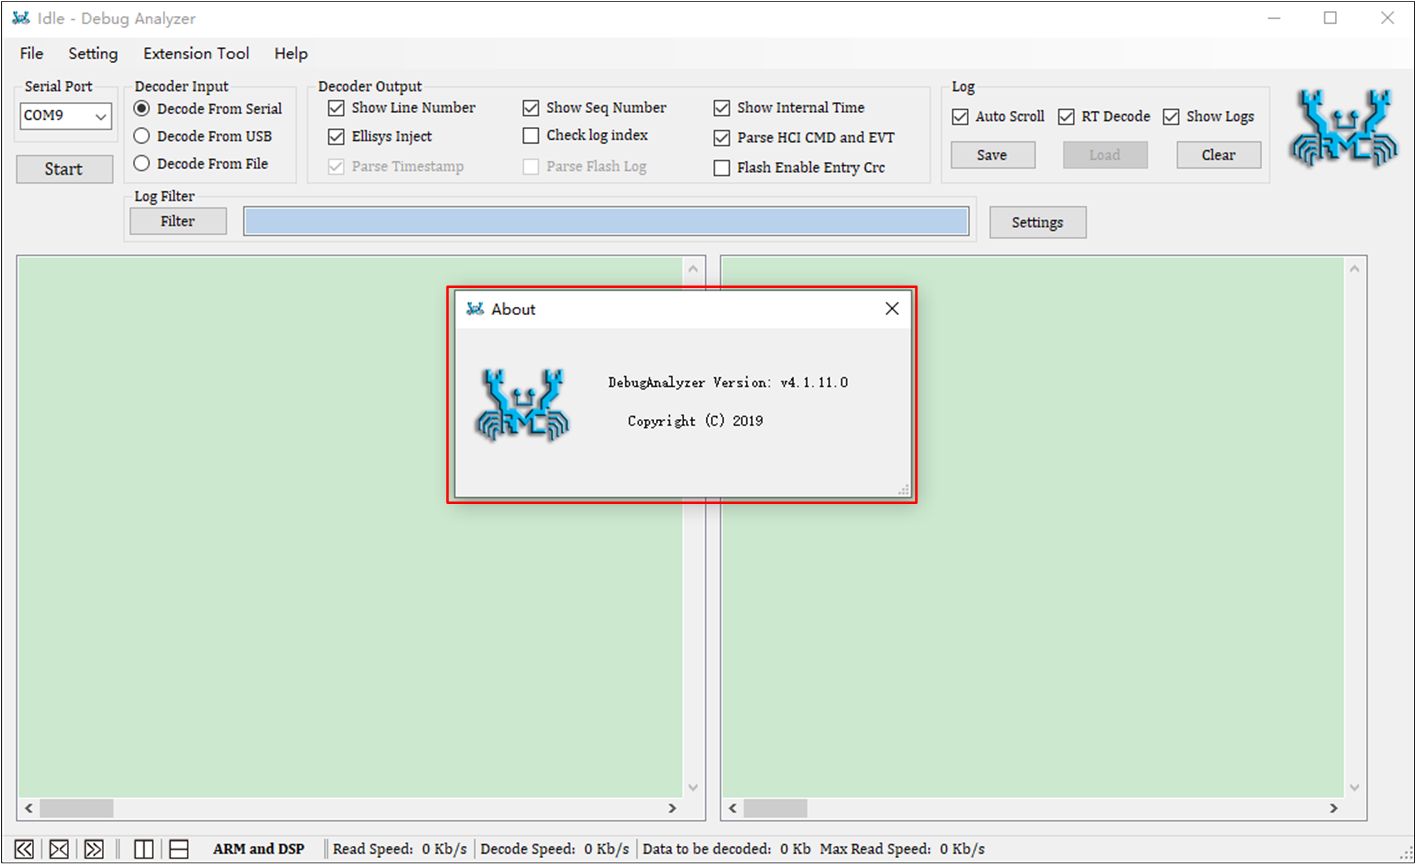
View Version of Tool