SWD
This introduction provides a general overview of the SWD debugging system.
SWD Hardware
SWD is a hardware interface standard developed by ARM for debugging and programming embedded systems. Compared to the traditional JTAG interface, SWD offers fewer pins, higher performance, and lower power consumption.
Jlink Connection
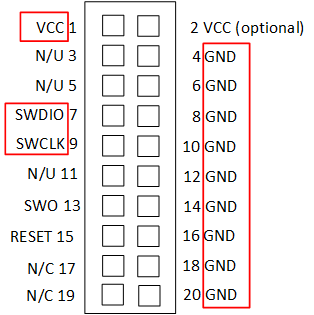
The SWD interface connection is straightforward and involves the following pins: VCC, SWCLK, SWDIO, and GND. These correspond to VDD, CLK, IO, and GND on the EVB.
SWD Interface
There are four pins to connect to the Jlink - VCC, SWCLK, SWDIO, and GND. These pins correspond to VDD, CLK, IO, and GND on the EVB board.
MCUConfig Tool Settings
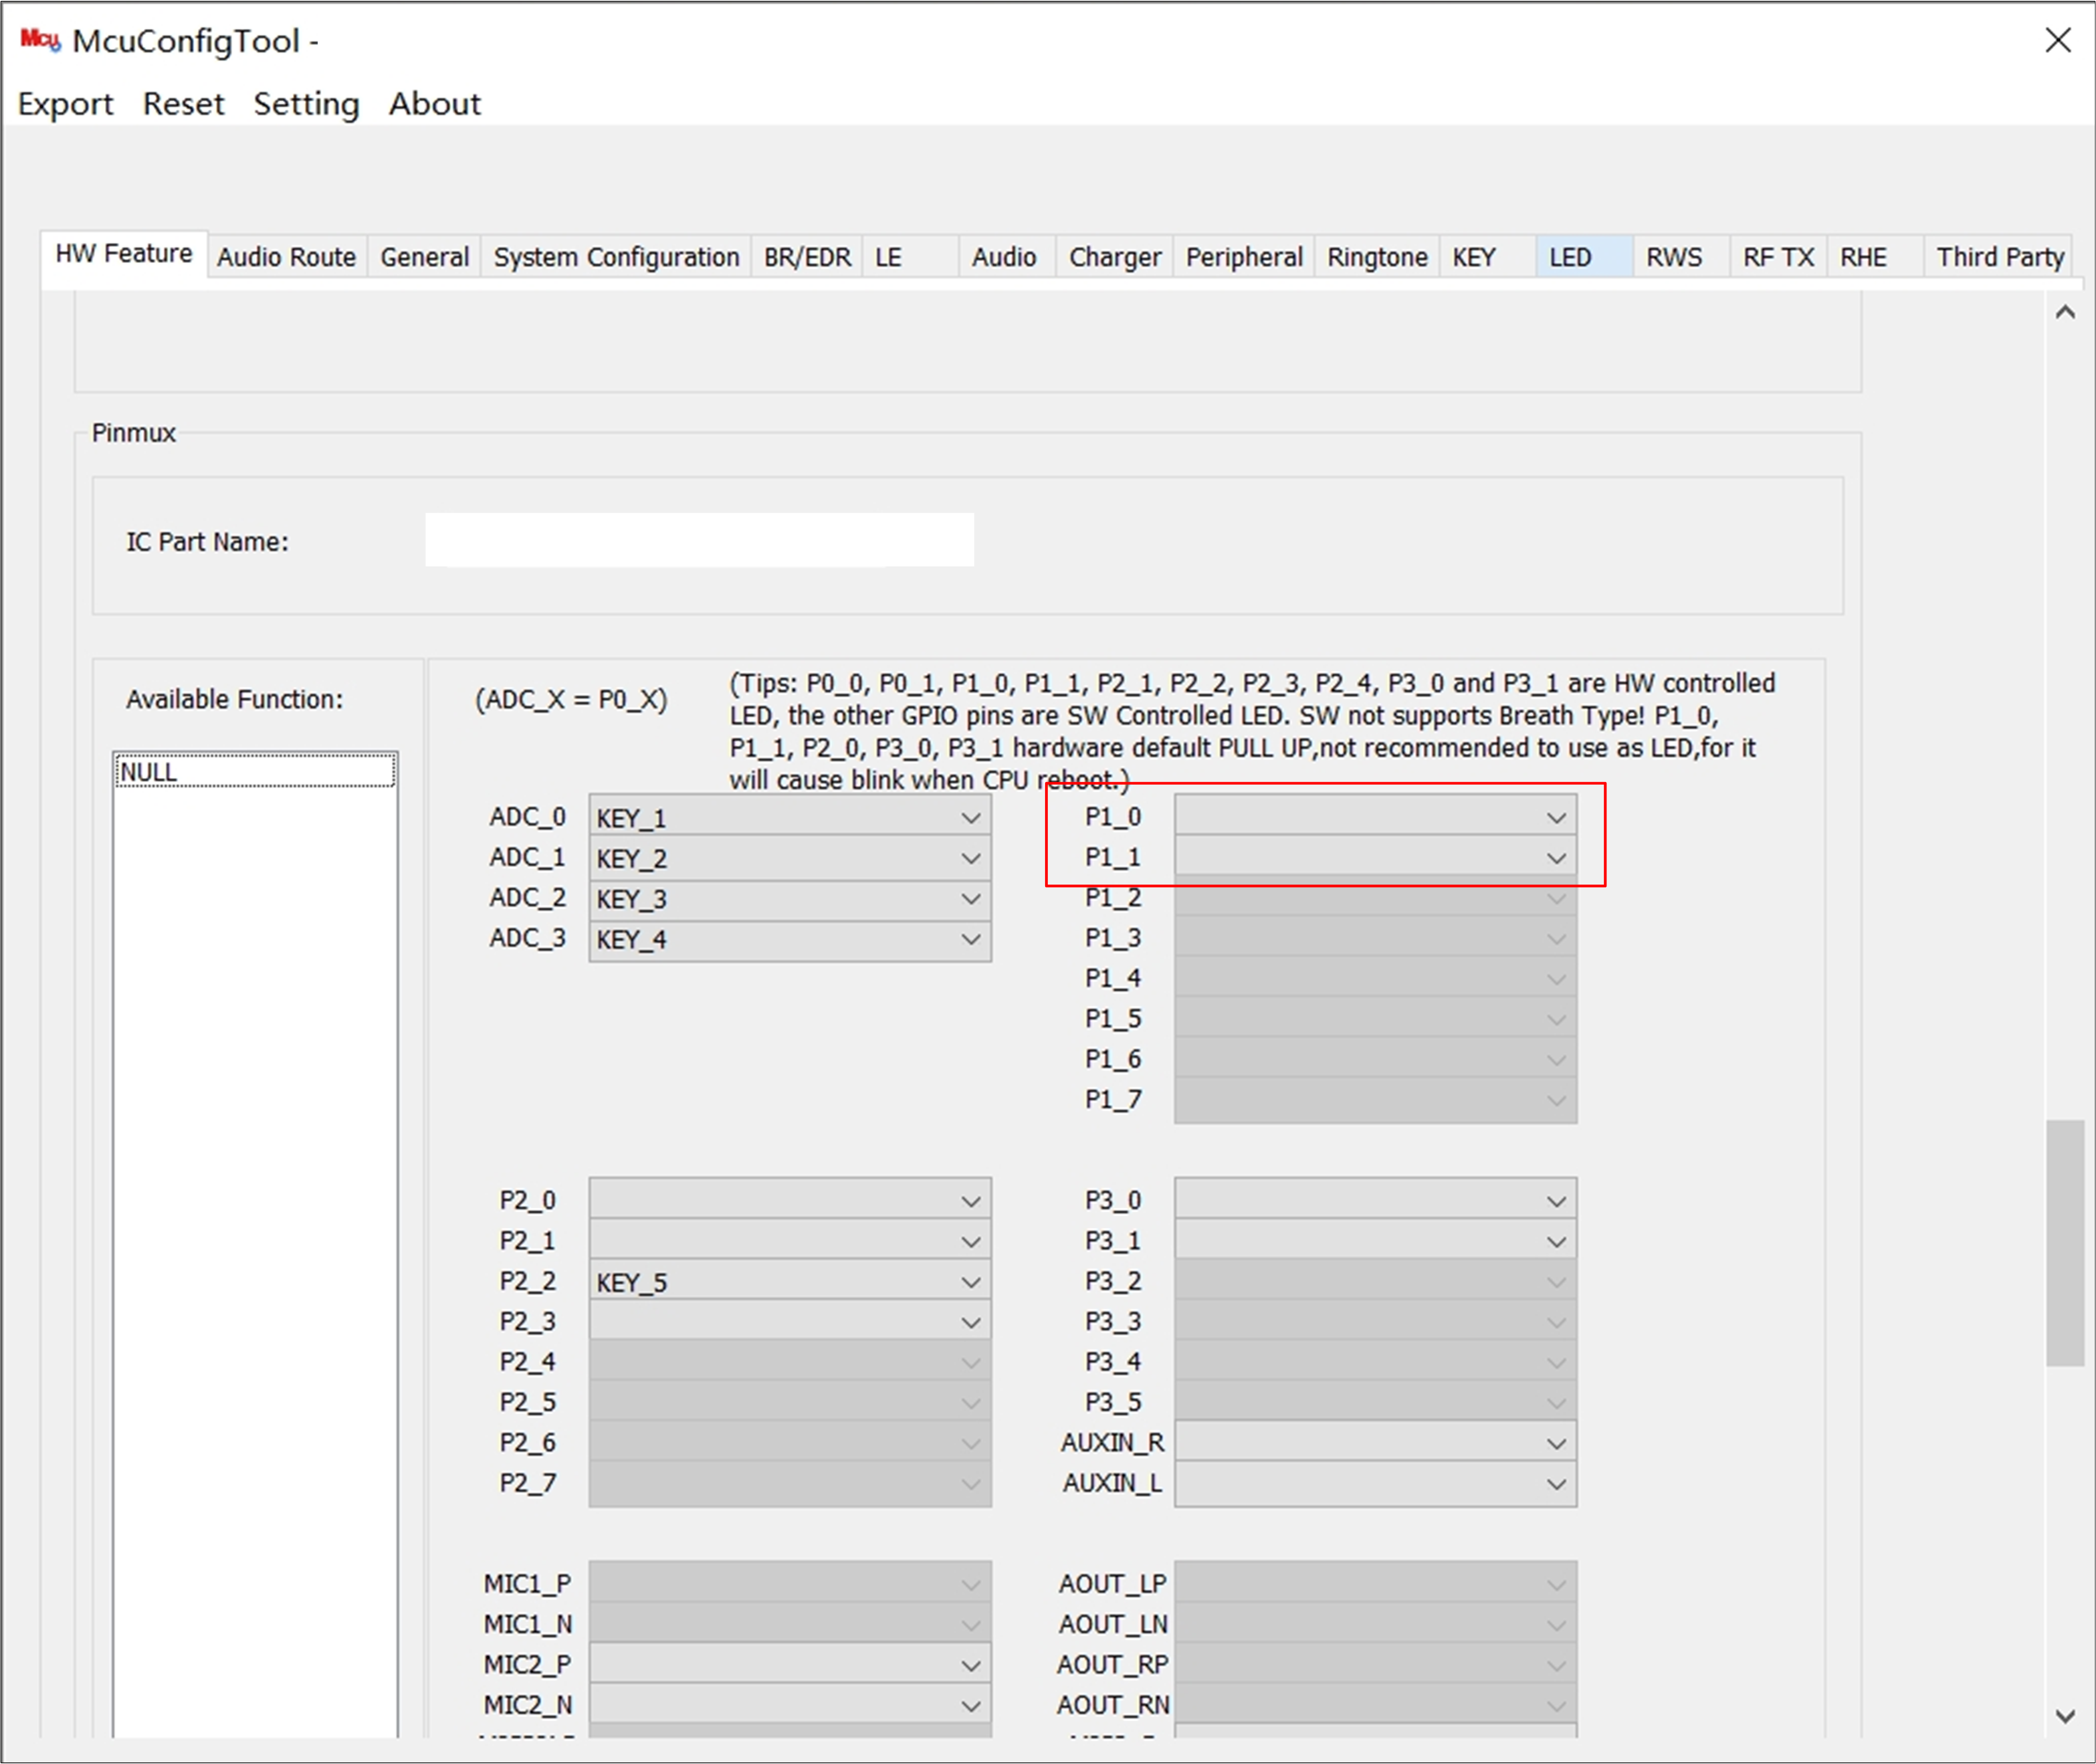
P1_0 and P1_1 pins are set to SWDIO and SWCLK, respectively. Therefore, avoid using P1_0 and P1_1 pins in the MCUConfig Tool.
Pin Setting in MCUConfig Tool
SWD with Keil
Using SWD with Keil μVision is a straightforward process that involves setting up your hardware and configuring the Keil debugging environment. Here’s a step-by-step guide to help you through the process.
Debug with Keil
Set the Debug Interface
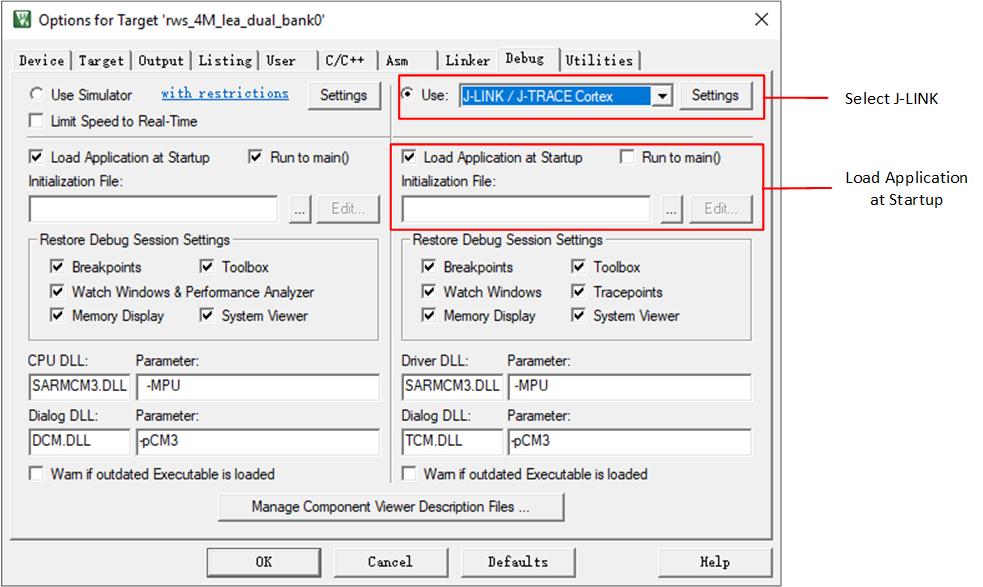
Install the appropriate Jlink driver and then select the corresponding one in Debug Tab of Options for Target…. We need to choose . Then, Disable Load Application at Startup which would reset the MCU.
Set Debug Interface
Set the Configuration for Jlink
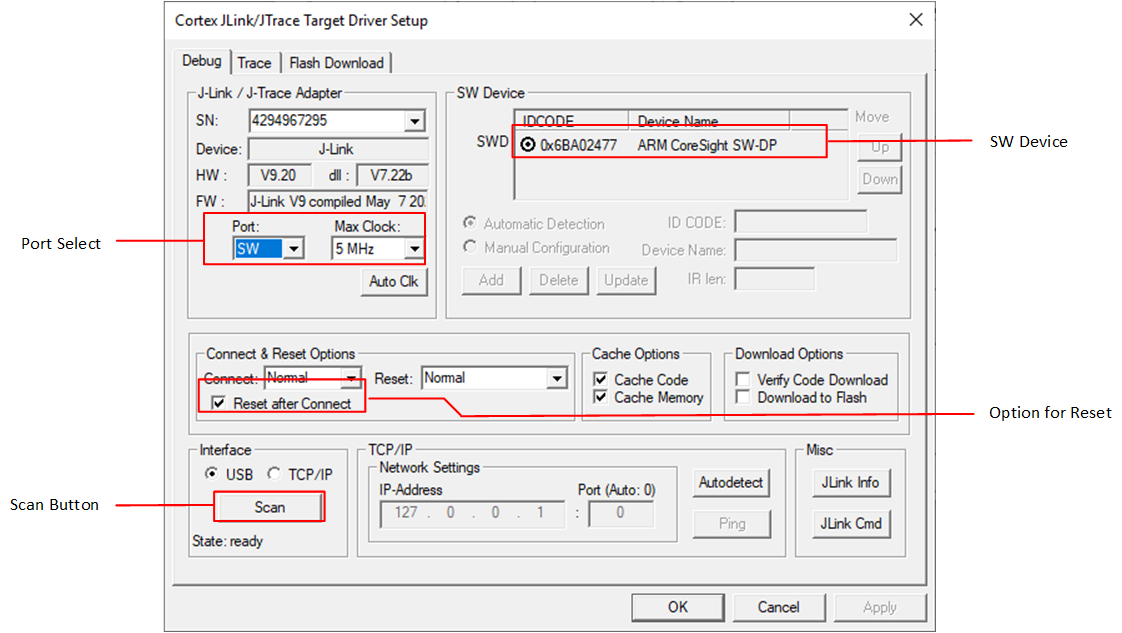
Make sure the MCU is not in the DLPS state and click the Settings button beside the debug driver. There will be a the Cortex Jlink/Jtrace Target Driver Setup window.
Set Configuration for Jlink
First, set the port to SWD and speed to 1MHz, and do not choose Reset after Connect. Then click the Scan Button, and you can see the device name with IDCODE in the SW device. If there is no information in SW device, please hardware reset the MCU and check the wiring for Jlink. By doing so, Keil can find SW device.
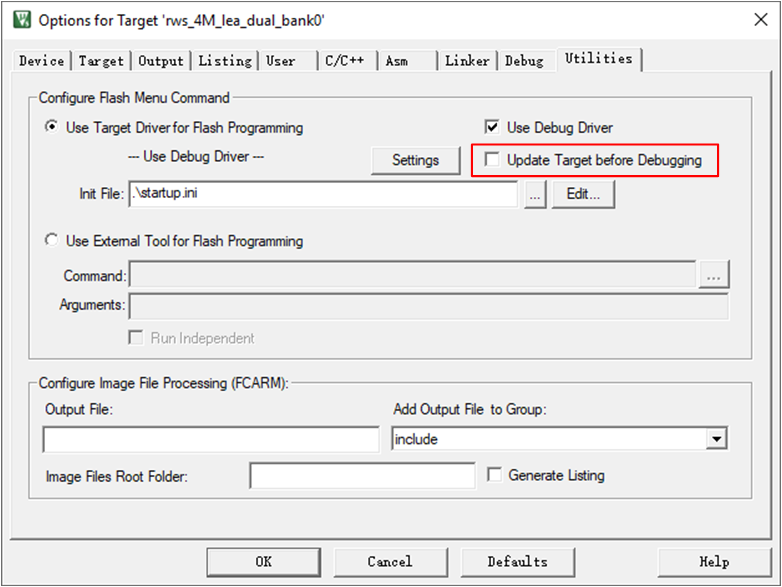
Disable the Target Download before Debugging
By default, Keil will download the image through Jlink when it starts debugging, so you need to disable the Update Target before Debugging option. This option is in the Utilities Tab of Options for Target.
Disable Target Update
Disable Watchdog and DLPS before Build
The purpose of disabling the watchdog is to not reset the MCU when it is halted by SWD. The way to disable the watchdog is as follows.
void system_init(void)
{
    wdg_disable();
    ...
}
Make sure the MCU is not in the DLPS state. The way to disable DLPS is as follows.
int main(void)
{
    ...
    app_cfg_init();
    ...
    app_cfg_const.enable_dlps = 0;
    ...
    app_dlps_init();
    ...
}
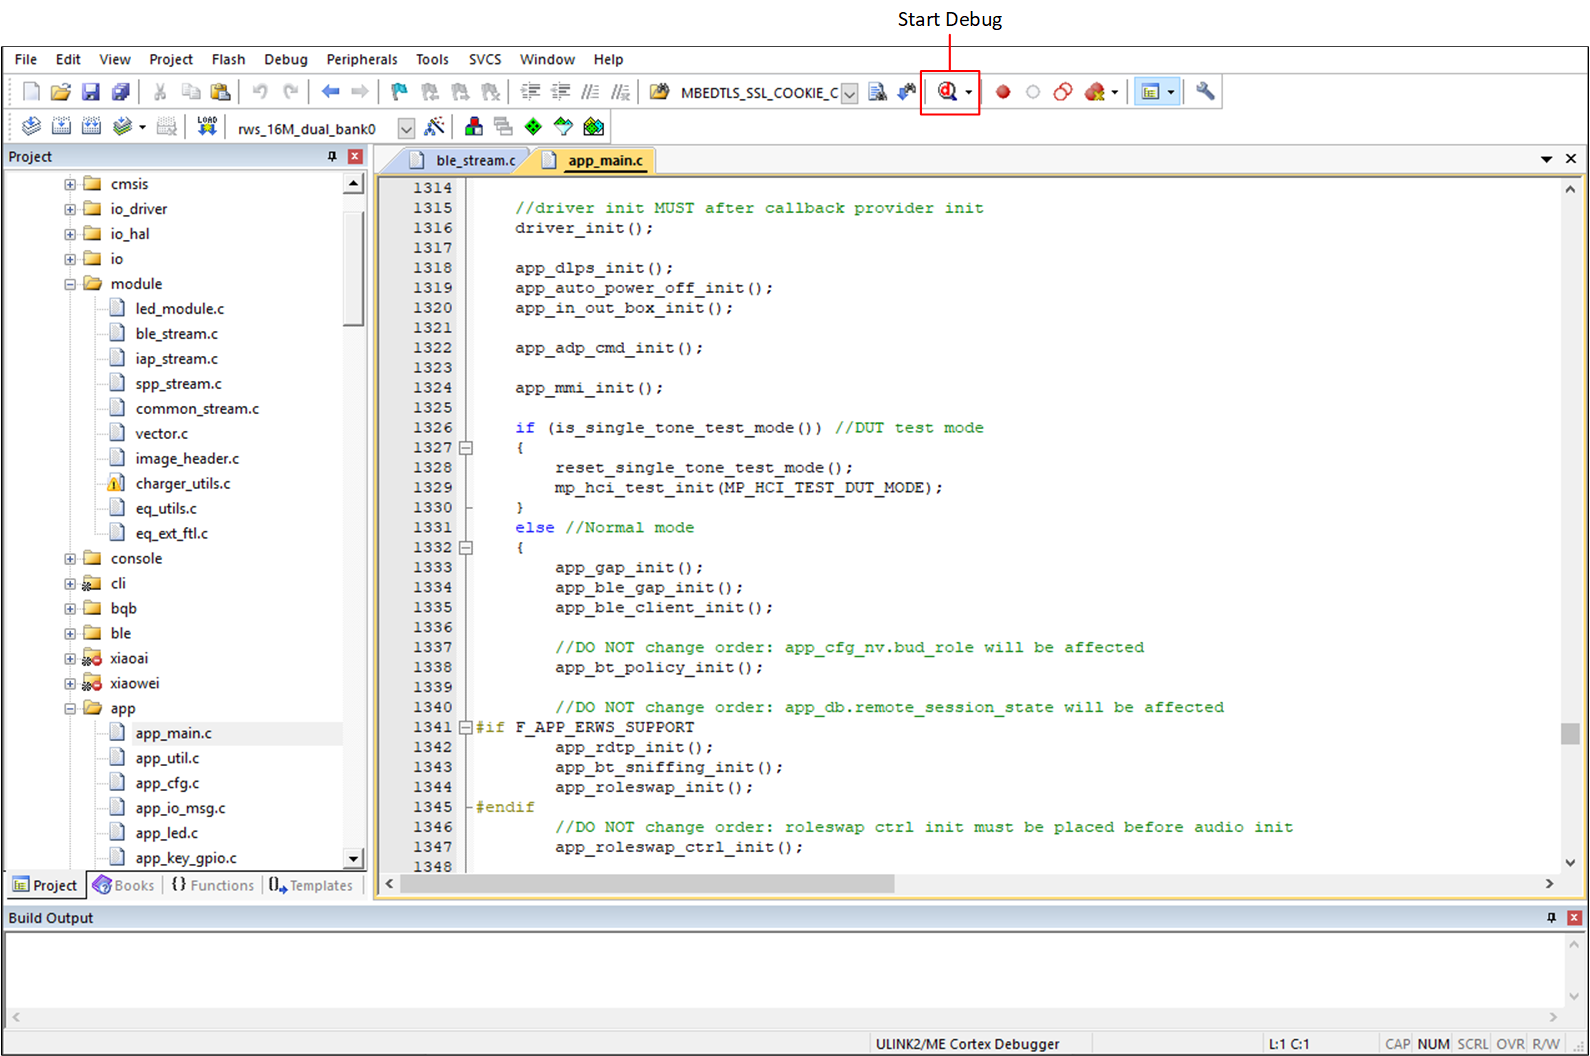
Start a Debug Session during Running
Click the Debug button to start a Keil debugging session in Keil main window and MCU will be halted.
Keil Start Debug
Input the load command as below in the command window.
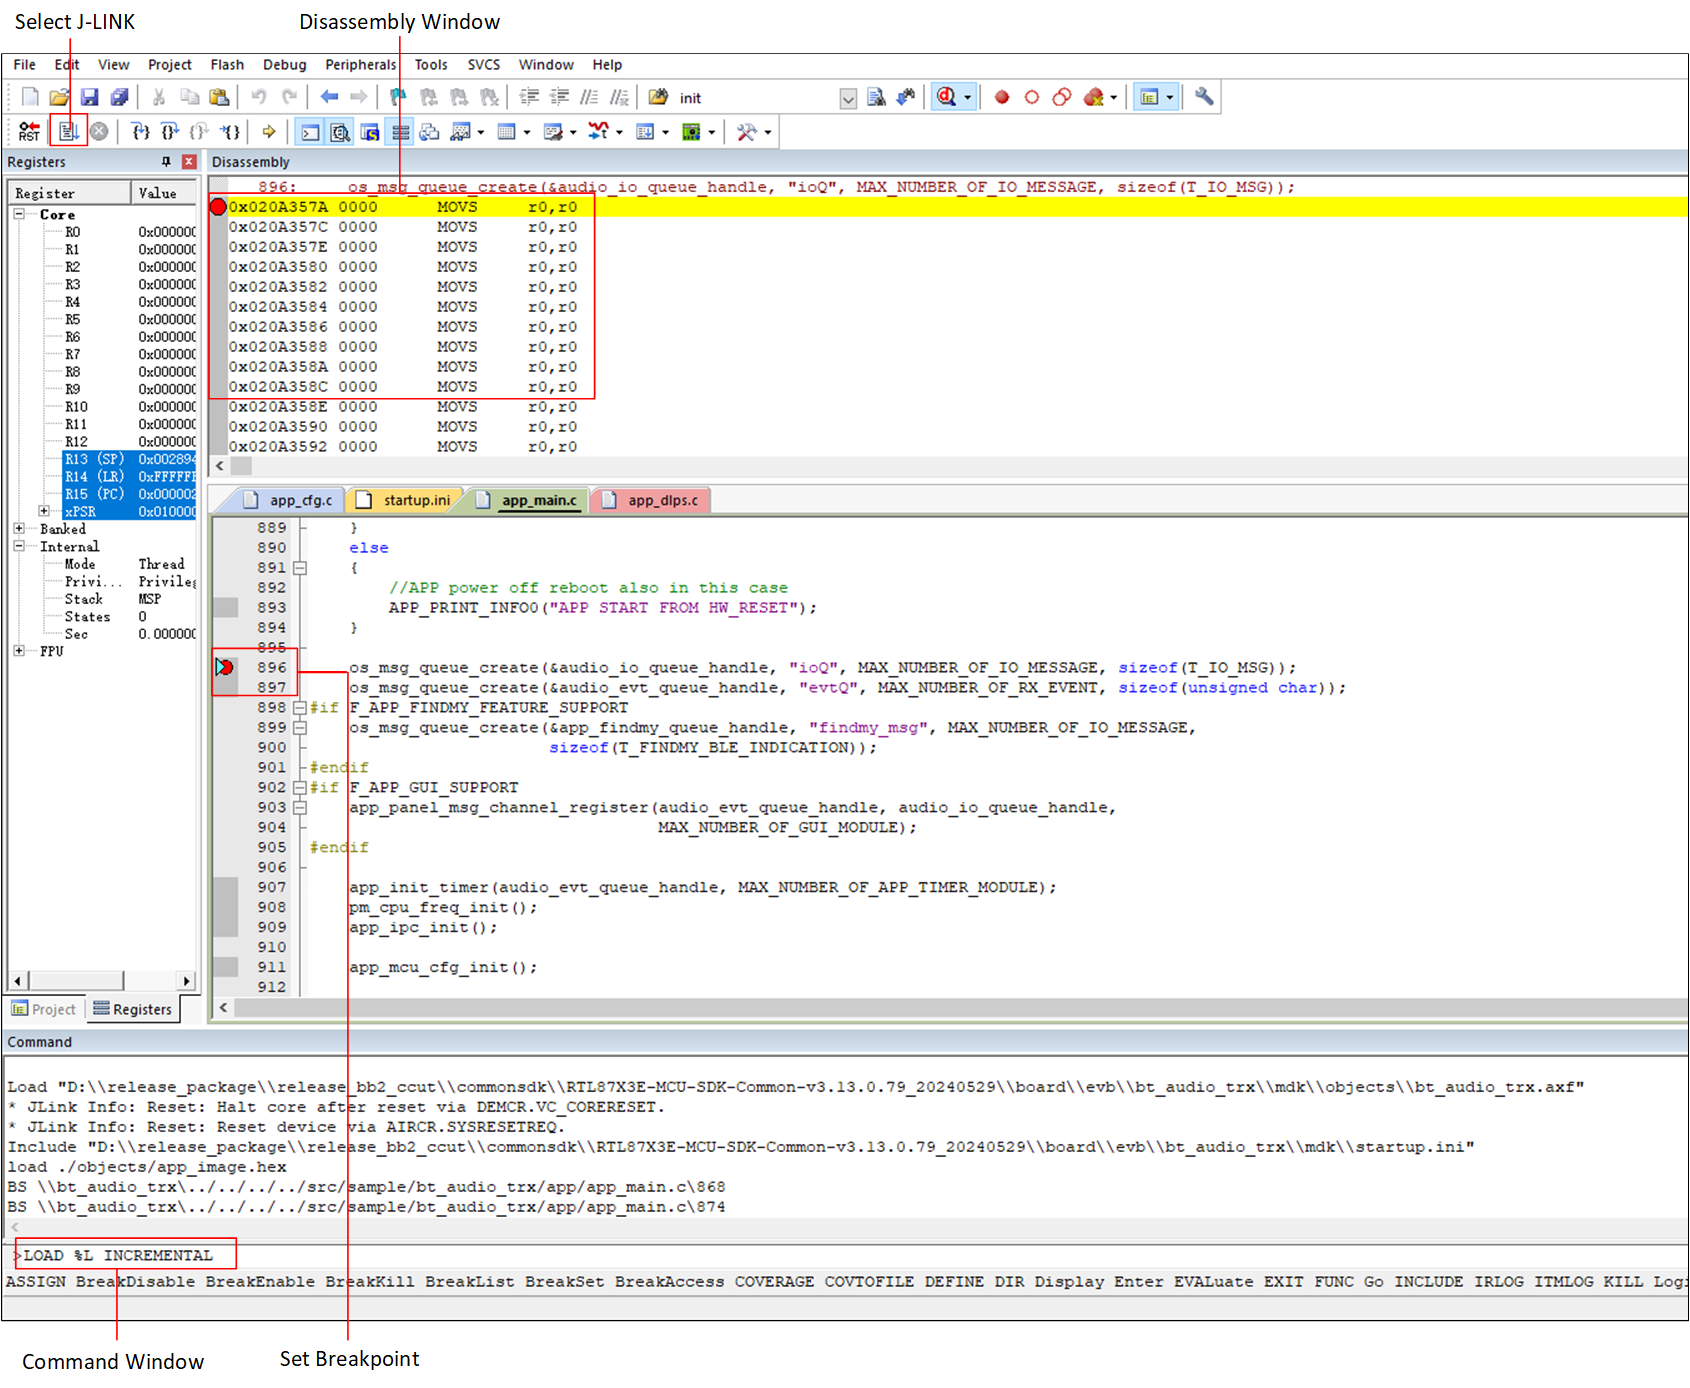
Set Breakpoints
Click the Run button and MCU will be halted at the breakpoint.
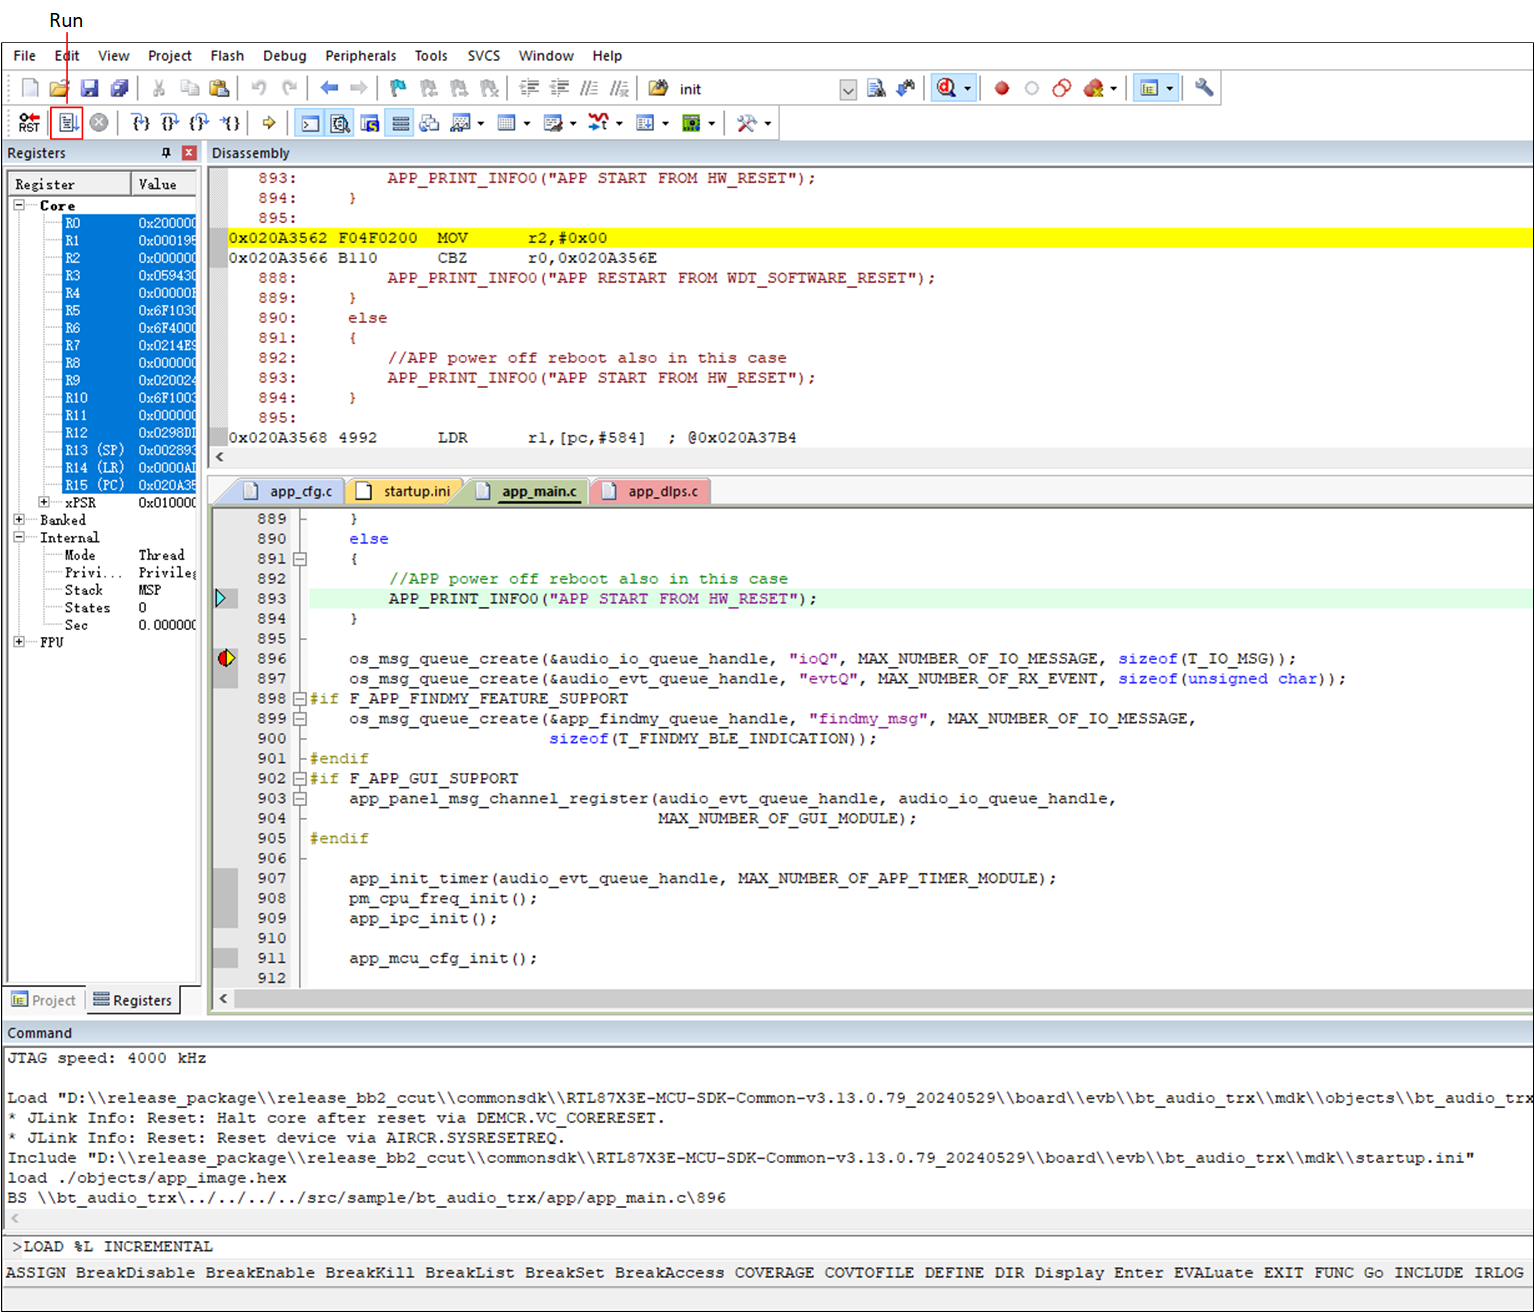
Click the Run Button
If there is a pop-up window that mentions that it cannot find SW device, please reset the MCU and go back to Cortex Jlink/Jtrace Target Driver Setup and follow the steps in Set the Configuration for Jlink to check SW device information, which means Keil scanned and found SW device.
Found Device
Start a Debug from Main Function
For the sake of capturing the MCU before running over the main function, we need to add a delay before the main function. We can add it in system_init of system_rtl8763.c. After pressing the reset key, you need to click Debug to start the simulation as soon as possible. Too fast and it will be too late to identify Jlink, too slow and it will run out of the main function.
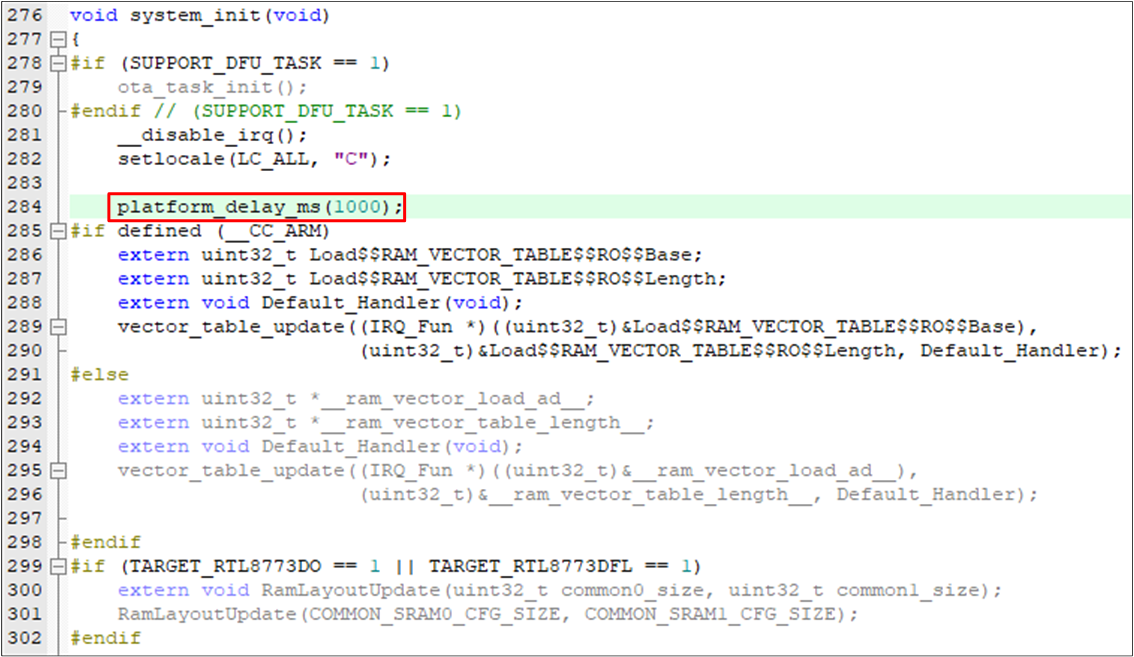
Add a Delay
Reset the MCU and click the Debug button to make the MCU halt before main.
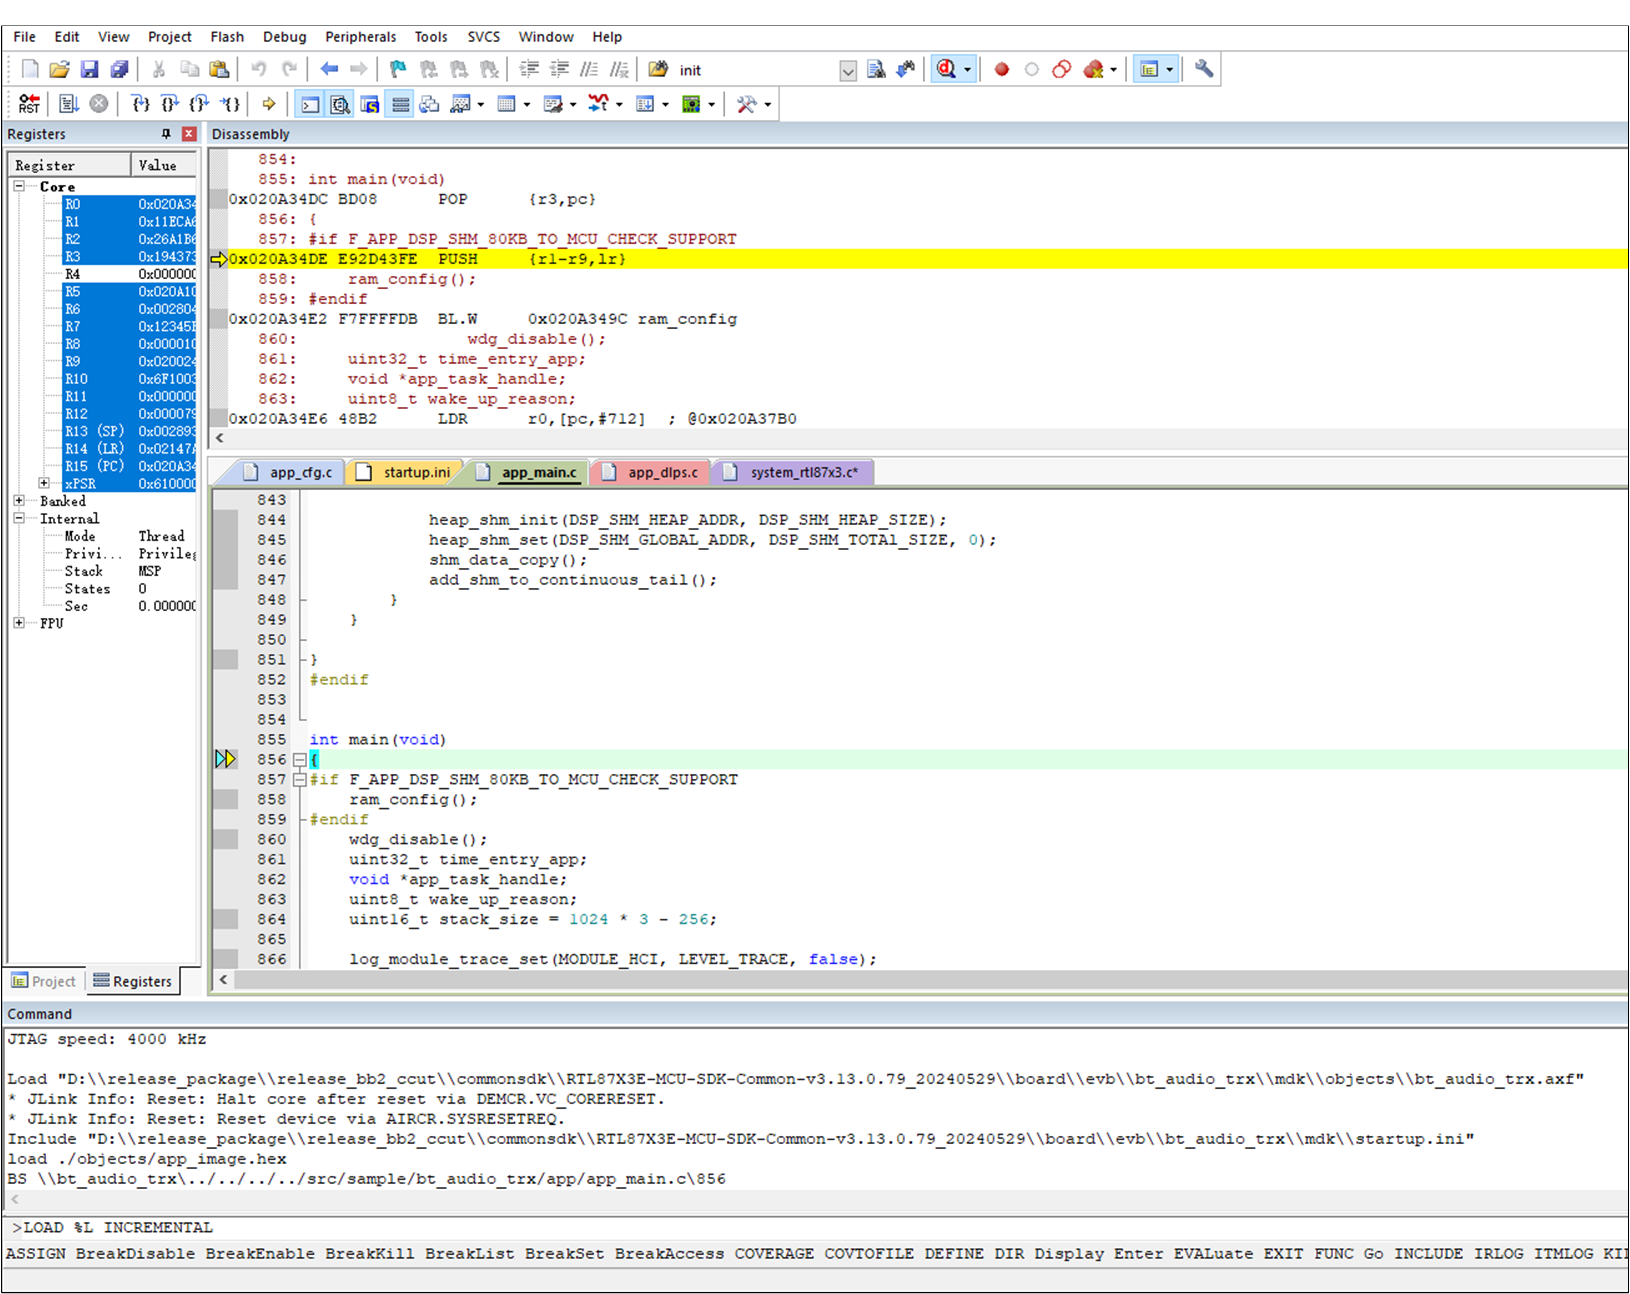
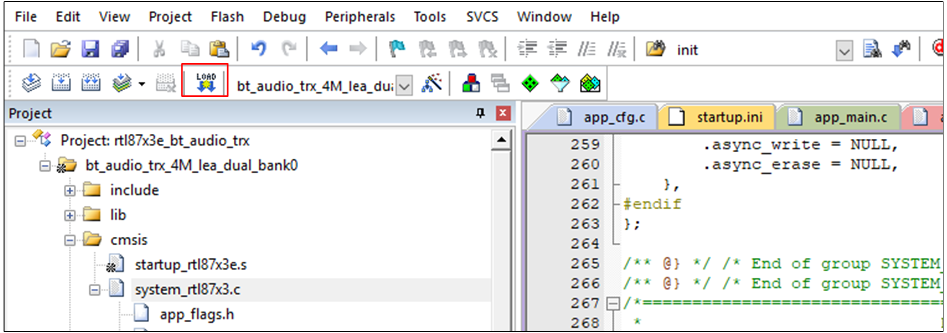
Input the command LOAD %L INCREMENTAL in the command window.
Set a breakpoint at the main and click the run button.
PC Stop at Main
Jlink download is not supported, so the modified code needs to be recompiled and returned before debugging. During debugging, the RESET button of Keil is not available. Please press the hardware reset on the EVB to start debugging from scratch.
Download with Keil
Do Set the Debug Interface and Set the Configuration for Jlink.
Copy
RTL87x3E_FLASH.FLMinsdk\tool\flashto Keil root directoryKeil\ARM\Flashand load theRTL87x3E_FLASH.FLMfile as below figure.
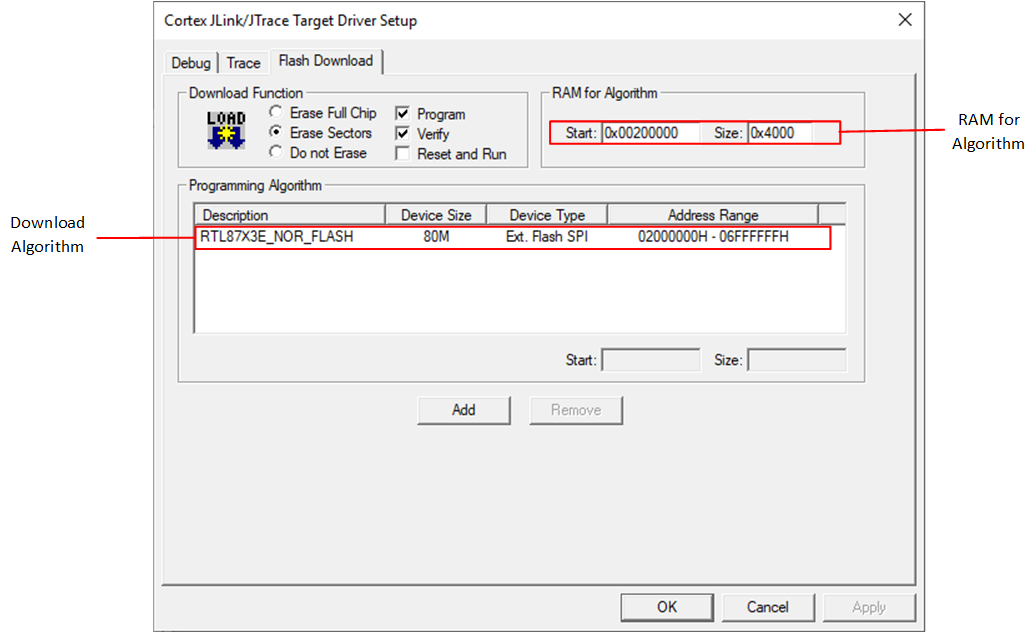
Keil Download Setting
Download bin with Keil.
Download Bin with Keil
SWD with Jlink Commander
Using SWD with Jlink Commander, a command-line utility provided by SEGGER, allows direct communication with the target device for purposes such as flashing, debugging, or performing other operations.
Preparation
This section describes the preparation before starting SWD debugging with Jlink Commander.
Jlink Commander (Jlink.exe) is a command-line-based utility that can be used for verifying the proper functionality of Jlink (the debugger) and for simple analysis of the target system. It supports some simple commands, such as memory dump, halt, step, go, etc. to verify the target connection.
Jlink Commander installation package is packed into https://www.segger.com/downloads/jlink/#JlinkSoftwareAndDocumentationPack. You can click the website and choose the platform you used.
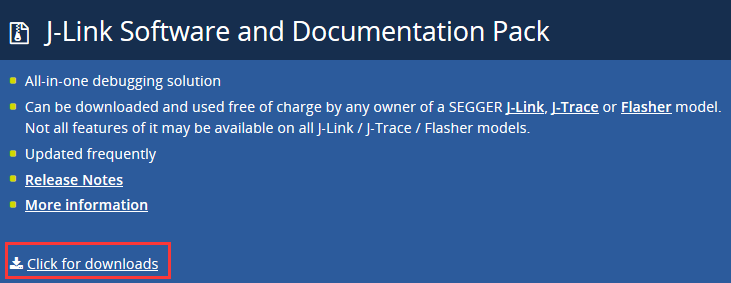
J-LINK/J-TRACE Package
Debug Feature Introduction
There are two categories of debugging methods: invasive debugging and noninvasive debugging.
Invasive Debugging:
Program halt and stepping.
Hardware breakpoints.
Breakpoint instruction.
Data watchpoint on access to data address, address range, or data value.
Register value accesses (both read and write).
Debug monitor exception.
ROM-based debugging (Flash patch).
Noninvasive Debugging:
Memory accesses (memory contents can be accessed even when the core is running).
Instruction trace (via the optional Embedded Trace Module).
Data trace.
Software trace (via the Instrumentation Trace Module).
Profiling (via the Data Watchpoint and Trace Module).
The most common debugging method is invasive debugging, which is used in this guide. So it should be emphasized that you should halt MCU with the command h every time you need to read or write registers.
Debug Procedures
Debug Configuration:
In the debugging setting, it needs to set the parameters about the target and debugging sessions.
Start the Jlink commander (by CONNEA or desktop shortcut).
Start Jlink
After Jlink Commander starts, you should use the command connect to start the setting for the debugging session.
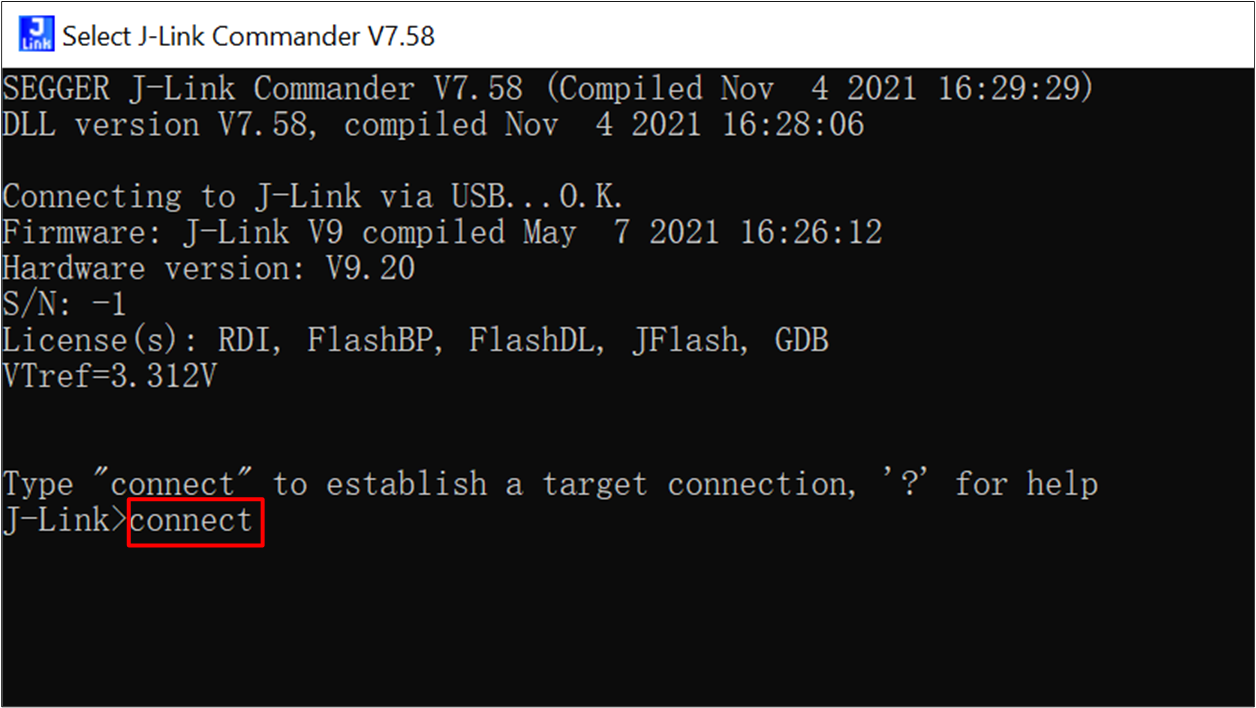
Connect MCU
Then you should select the device/core to which the MCU belongs. It is Cortex-M4 for RTL87x3D and Cortex-M3 for RTL87x3E.
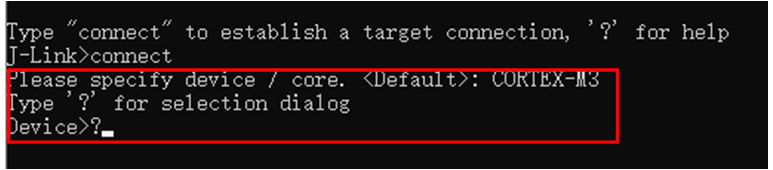
Specify Device Core
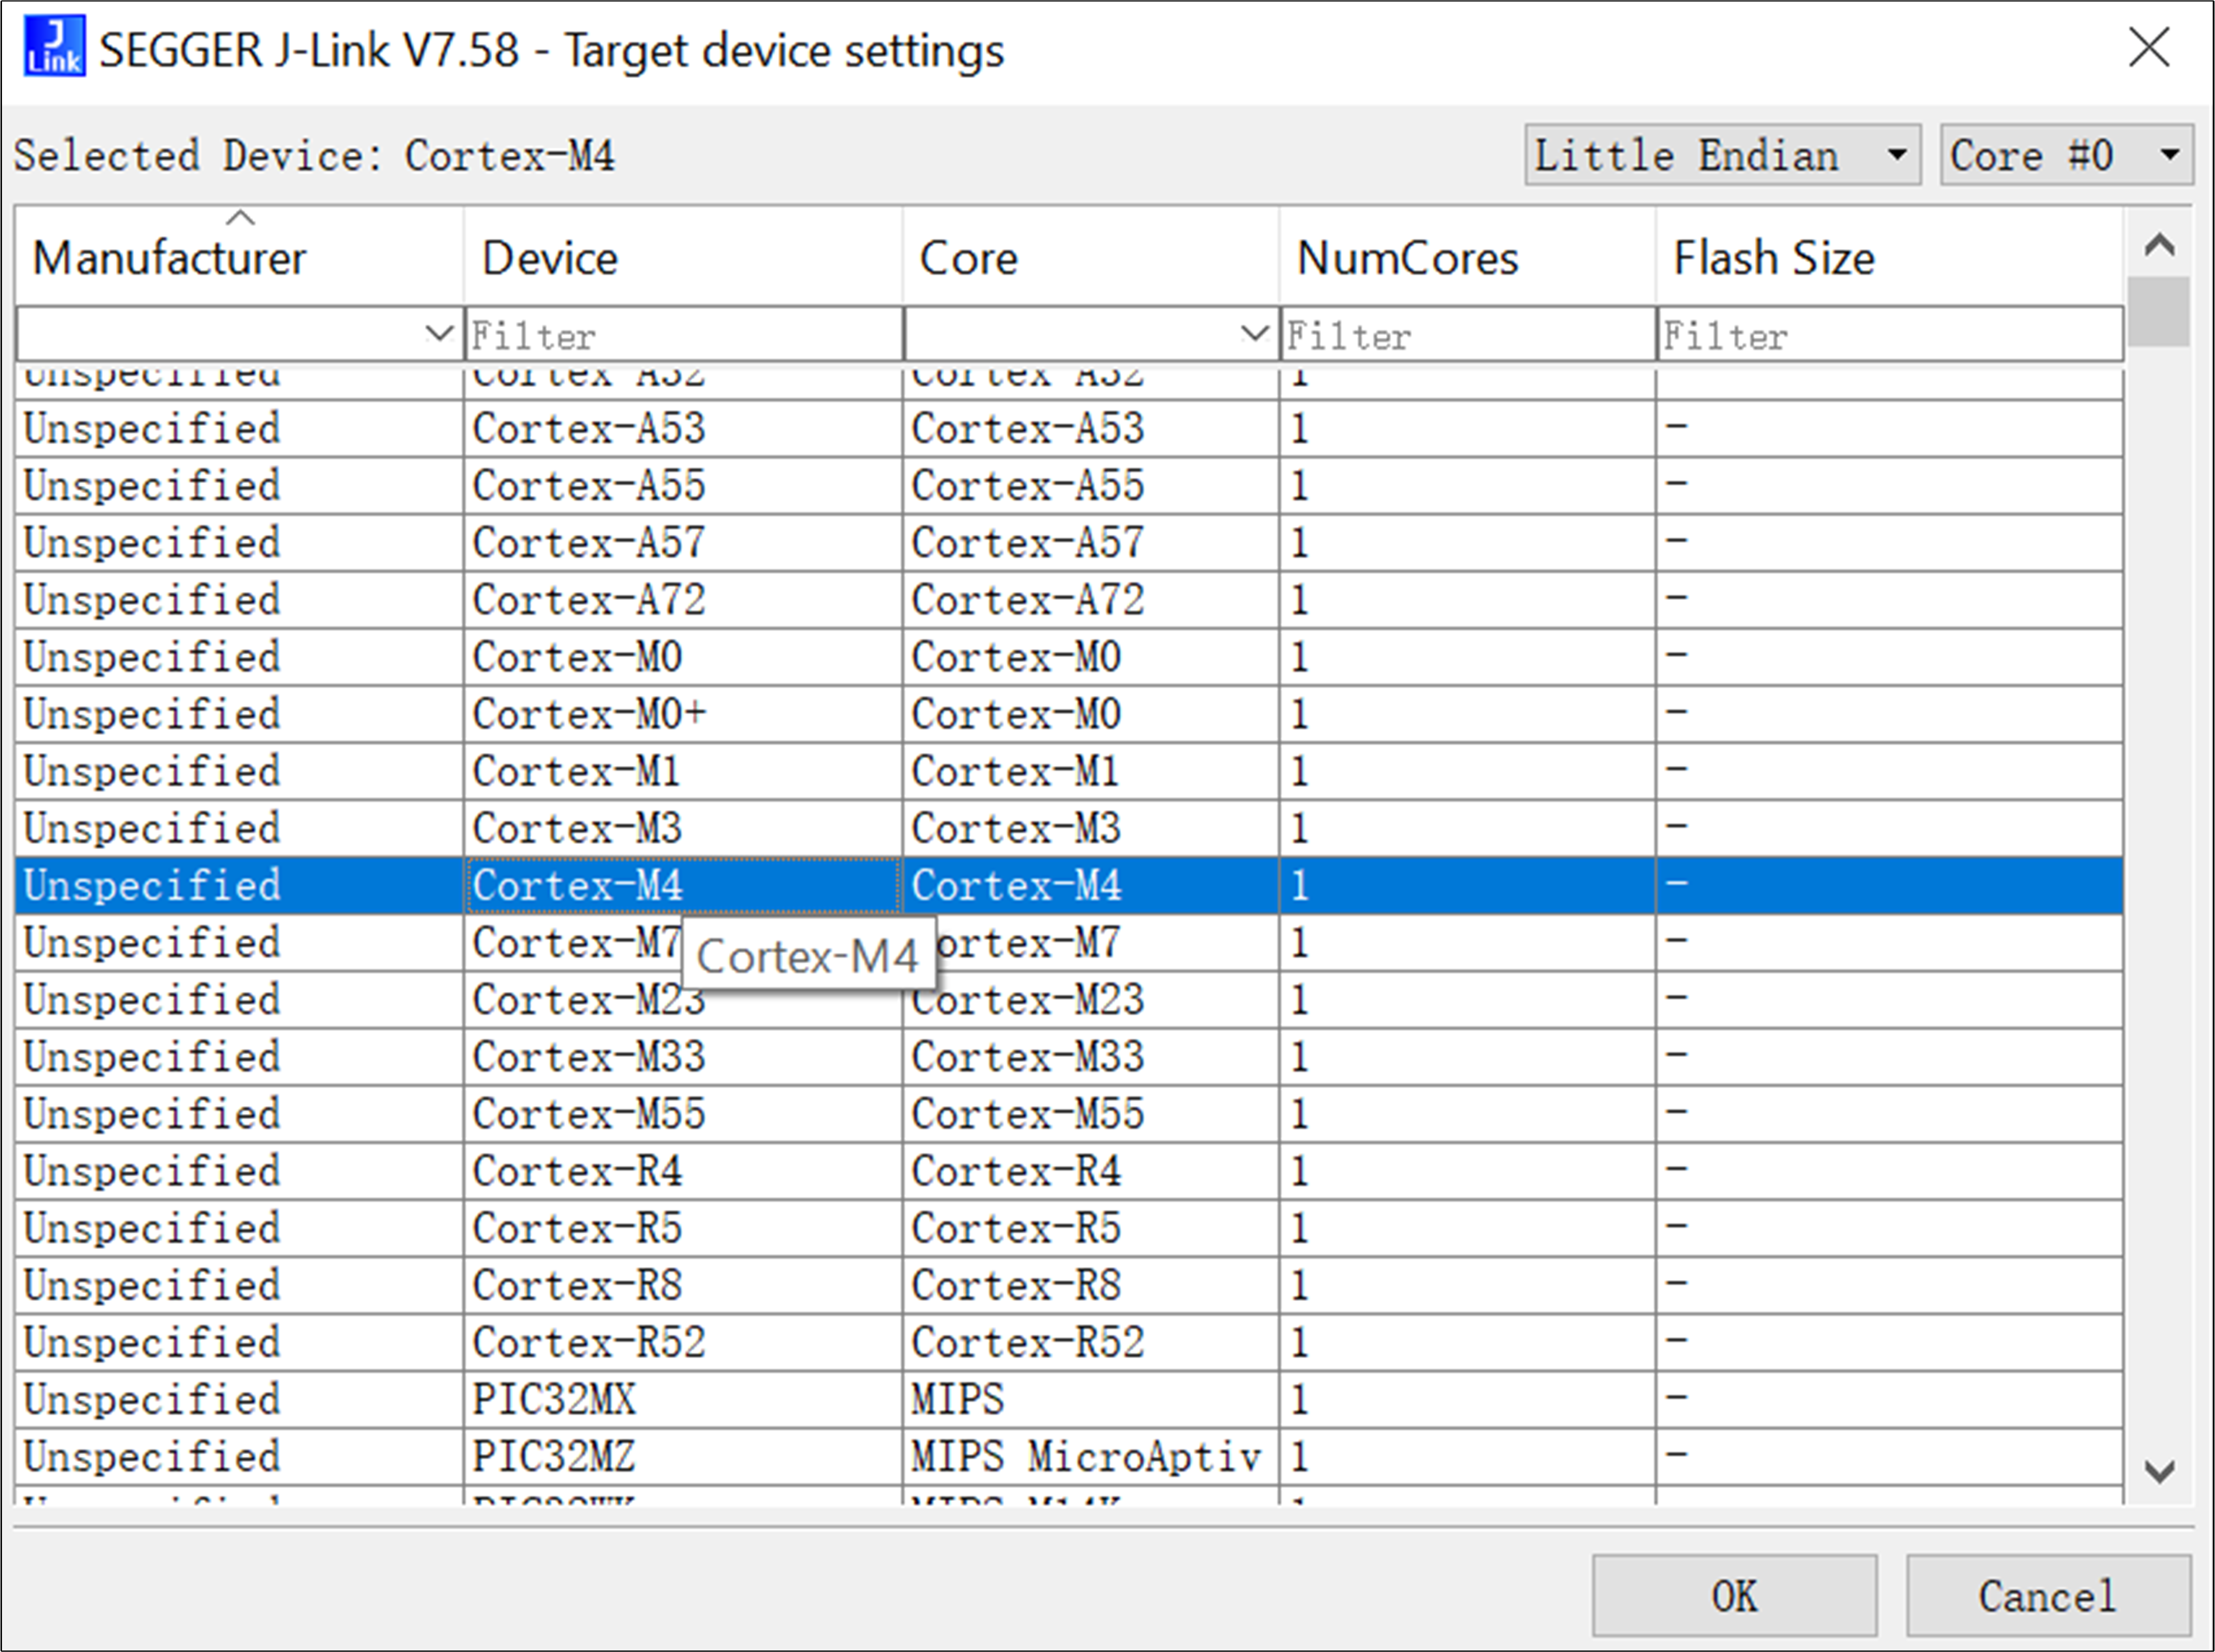
Select Cortex Core
Please specify SWD as the target interface.
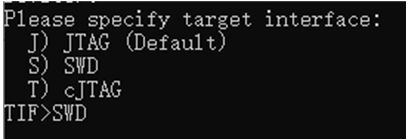
Specify Target Interface
You can also set the interface speed of SWD. The default speed is 4000kHz, and you can use this value by inputting Enter key directly. It is recommended to be below 2000kHz for debugging stability.

Specify SWD Speed
Finally, Jlink Commander will print the following information. It means debugging configuration is finished!
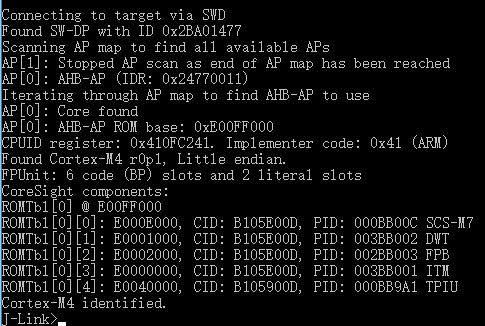
Debug Info
Capture MCU before Main:
Because the first 32KB in ROM was protected for security, SWD could not halt MCU by its reset command h. To this limitation, it is difficult to debug the app from the main function directly. It needs to add a dead loop and set PC to the top of the main loop.
The steps are as follows:
Add a dead loop in system_init in
system_rtl8763.c: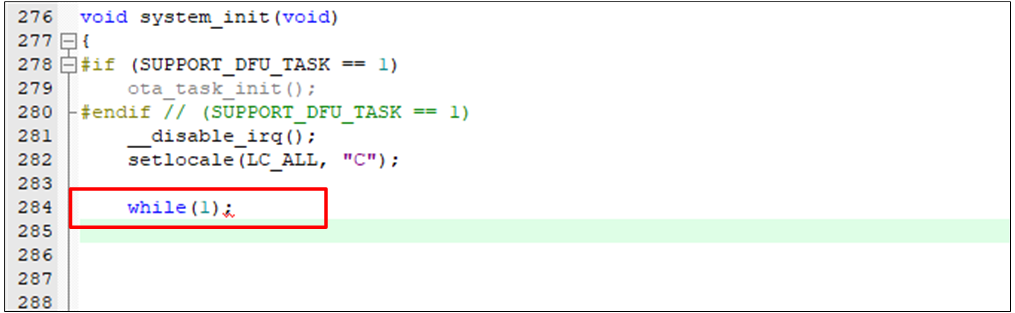
ADD Deadloop
Connect MCU by following the steps in Debug Configuration.
Halt MCU by h, and check whether MCU is running in the loop:
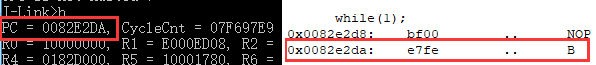
PC Address
Set the PC to the top of the main function by the SetPC command. Here app’s main function is at 0x831e96:
PC in Jlink
Breakpoint Debugging:
The most commonly used debugging function is breakpoint. In Jlink Command, the breakpoint command is SetBP. For actual debugging, it should be used in combination with the command go.
Use SetBP to set a breakpoint in the form of an assembly address. Handle is the number used to remove a breakpoint with ClrBP.
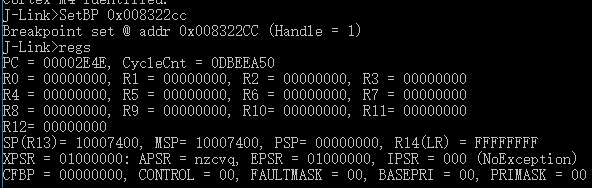
Set BP
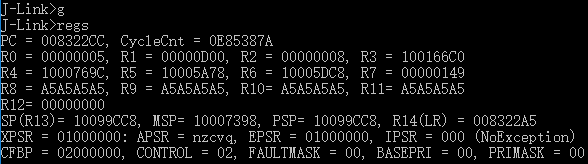
Input g or go to make MCU run at full speed. You will see there is no response, but MCU has been halted at the breakpoint you set before. And you can use regs to check this.
Halt BP
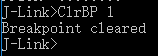
If you don’t need the breakpoint anymore, ClrBP should be used. You will see the hint that Breakpoint is cleared.
Clear BP
Watchpoint Debugging:
Watchpoint can be considered as a kind of condition breakpoint. For example, a variable
helloof type uint8_t is added, and it is added in the main while loop as follows.You can check its address and the code in the
.disasmfile.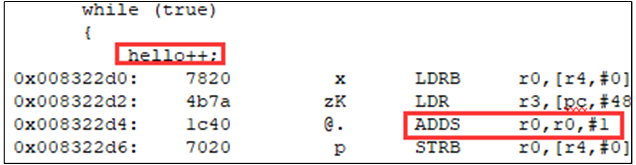
Assembly Address for Hello

Address for Hello
Set a watchpoint at 0x1000769C for
hello.
Set Watchpoint
Let MCU run and it will be halted automatically when
hellogrows up to 5. Check the registers and you will find that 0x8322DE is near 0x8322D4. 0x8322DE is the place MCU writes the value back to 0x1000769C.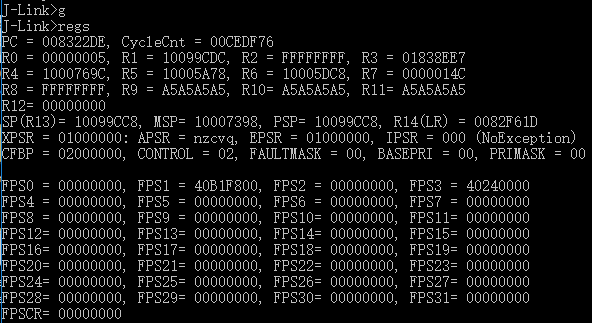
Check Register

LDR Value at 0x8322de
Finally, you can look into the 0x1000769C by mem:
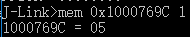
LDR Value at 0x1000769C
Single Step Debugging:
The single-step debugging command is s. If you want to single step through your program, you should halt MCU by h first. Then you are enabled to go through the program step by step with s.

Halt MCU and Single Step
Commander Commands
connect
Syntax: connect
This command is not listed in the commands help list. As depicted in Debug Configuration, it starts the setting for the debugging session. It is always the first step when using the SWD to debug.
h
Syntax:h
This command means halt, which will stop MCU. It’s a common command in MCU debugging.
s
Syntax:s
Single step the target chip.
mem, mem8, mem16, mem32
Syntax:
mem Addr, NumBytes
mem8 Addr, NumBytes
mem16 Addr>, NumBytes
mem32 Addr, NumBytes
All these commands are used to read the memory. Both mem and mem32 are the most common commands. mem can read the memory with arbitrary size and mem32 can read the memory with the unit of one word in ARM.
w1, w2, w4
Syntax:
w1 Addr, Data
w2 Addr, Data
w4 Addr, Data
These commands can write a value to a certain address.
q
Syntax: q
This command means quit, which can close Jlink Commander.
r, rx
Syntax:
r Reset.
rx DelayAfterReset.
r and rx can reset the target chip. rx can reset the MCU after a specified interval.
Regs
Syntax: Regs read general purpose registers.
This command is a very common command in almost all command-line debuggers. It can read all the general purpose registers, such as R0-R12, LR, and PC.
wreg
Syntax: wreg RegName, Data.
This command can write a value to a specific register.
SetBP
Syntax: SetBP addr.
This command is used to set the breakpoint. It is usually used in combination with the command g. Command g makes MCU run at full speed and if it reaches the breakpoint, MCU can be suspended by Jlink.
ClrBP
Syntax: ClrBP BP_Handle.
This command is used to clear breakpoints which you don’t need anymore.
SetPC
Syntax: SetPC Addr.
This command can set the current PC to a specified address.