Optimizing Current Consumption
Current consumption, or more generally, energy usage, is a major concern for battery-powered products. Optimizing current consumption extends battery life and, consequently, improves product performance. The following topics are intended to help users optimize power consumption.
Static Power State
Bluetooth Low Energy State
Bluetooth State
Overview
There are three main factors that affect current consumption in a Bluetooth Audio SoC device.
-
The static power state of the SoC.
-
The amount of power transmitted.
The amount of transmit power required includes transmit/receive power, which depends on the desired distance between the central and peripheral devices. The range is greatly influenced by environmental factors such as obstacles and the amount of 2.4 GHz traffic present. The first tip for power consumption optimization is to avoid transmitting more power than necessary.
-
The total amount of time that the Bluetooth is active.
The amount of time that Bluetooth is active is determined by how often it needs to transmit or receive data and the duration of each transmission or reception. The first and most obvious tip is to keep the characteristics small. If 8 bits are sufficient, do not use a 32-bit integer.
In general, the power consumption of a Bluetooth Audio SoC device can be optimized by adjusting parameters related to advertising and connection states.
Note
The following test results are based on a specific board. All values are obtained from actual measurements performed using a specific image, and are only provided as an example. For detailed information about power consumption values, please refer to the data provided in the HDK.
Static Power State
Static power consumption affects the basic power consumption of the system.
Power Mode
The power modes of the platform include active mode, DLPS mode, power down mode, and ship mode. The platform must stay in an active state when Bluetooth is active. When Bluetooth is not active and in deep sleep mode, the platform can enter DLPS mode to reduce power consumption.
Note
In general, Bluetooth test scenarios will be carried out in active or DLPS mode.
RTL87x3E
Example:
Test Condition |
Power Mode |
Current (uA) |
|---|---|---|
|
IC: 8773EFE VBAT: 3.7V |
Active Mode |
879 |
DLPS Mode |
29 |
|
Power Down Mode |
5.7 |
|
Ship Mode |
1.5 |
DVFS and CPU Frequency
DVFS can dynamically adjust voltage and frequency and has two modes: high-performance mode and low-performance mode. High-performance mode consumes more power than low-performance mode. However, when the frequency of the CPU or DSP exceeds a certain specific value, DVFS must switch to high-performance mode.
The frequency of the CPU can be set to different values within a certain range, and the higher the frequency, the more power is consumed. And when the CPU is in an idle state, the CPU can go into WFI to reduce power consumption.
Note
The following Bluetooth test scenario is as follows.
DVFS works in low-performance mode.
The CPU frequency is 40M and can enter WFI.
No DSP.
RTL87x3E
Example:
Test Condition |
DVFS |
CPU State |
CPU Frequency |
Current (mA) |
|---|---|---|---|---|
|
IC: 8773EFE VBAT: 3.7V |
High Performance |
WFI |
625K |
0.929 |
Active |
100M |
4.169 |
||
80M |
3.340 |
|||
40M |
2.024 |
|||
Low Performance |
WFI |
625K |
0.879 |
|
Active |
40M |
1.875 |
||
20M |
1.397 |
RF Receive Power
The RF receive power is fixed.
RTL87x3E
Example:
Test Condition |
State |
Test Case |
Packet Type |
Current (mA) |
|---|---|---|---|---|
|
IC: 8773EFE VBAT: 3.7V CPU: 40M DVFS: Low Performance Power Mode: Active Mode Measuring Time: 10s |
Packet Receive (for MP) |
BR |
DH5 |
7.486 |
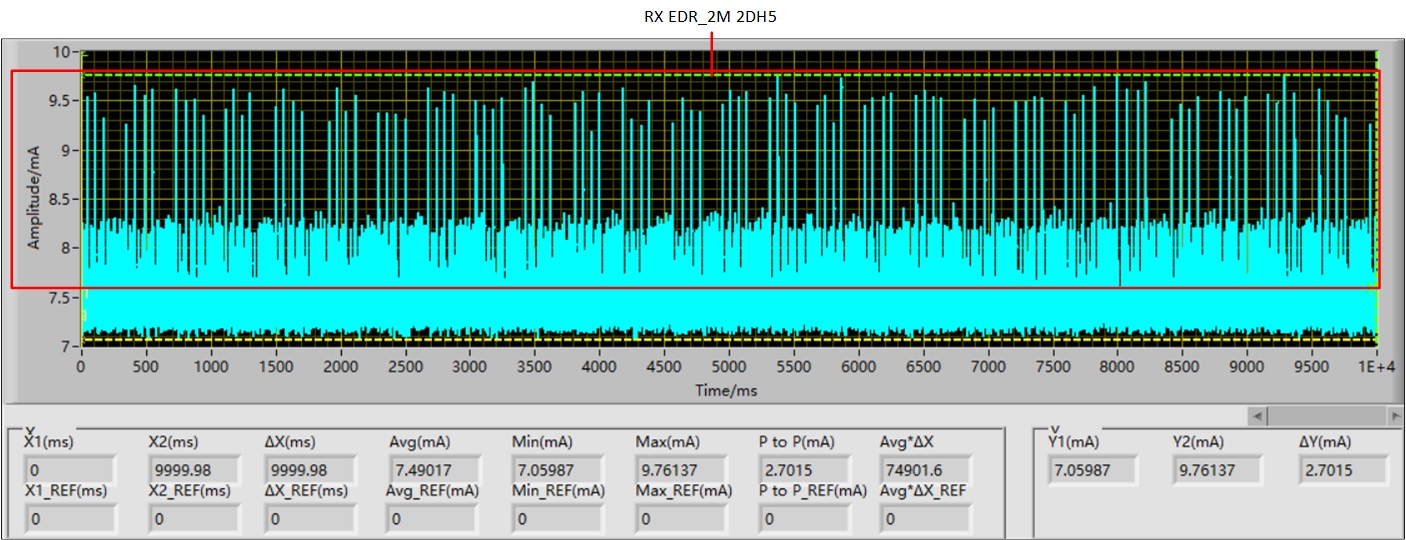
EDR_2M |
2DH5 |
7.490 |
||
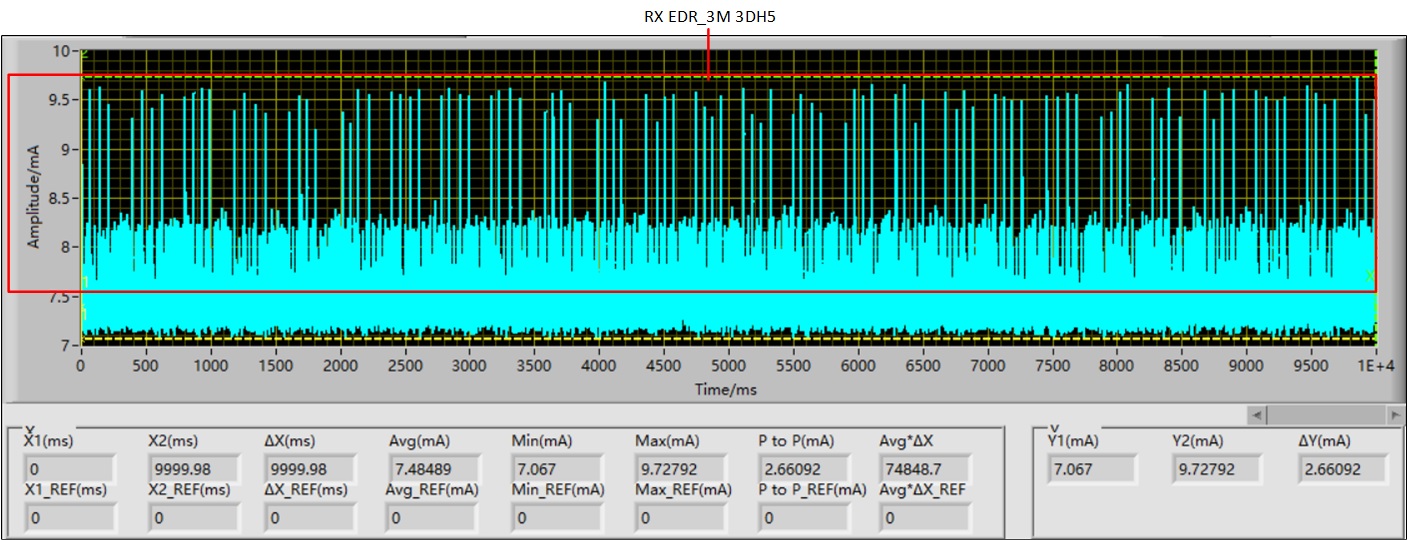
EDR_3M |
3DH5 |
7.485 |
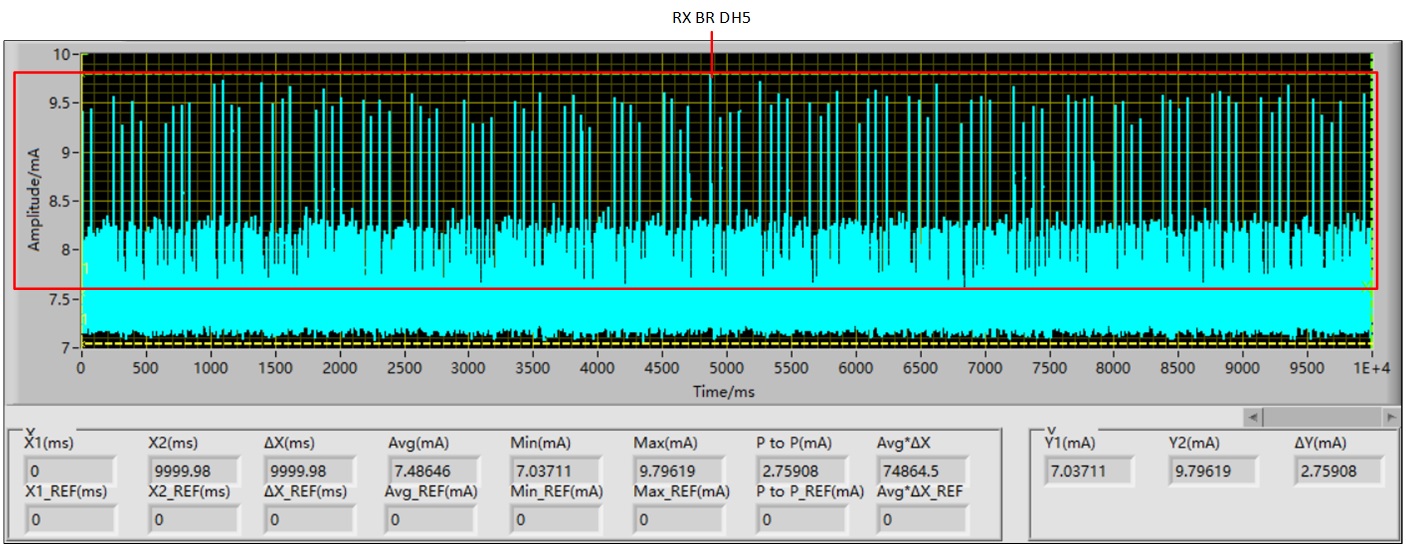
RX BR DH5
RX EDR 2M 2DH5
RX EDR 3M 3DH5
From the above results, there is no difference between the receive power consumption of BR and EDR.
Test Condition |
State |
Test Case |
PHY |
Current (mA) |
|---|---|---|---|---|
|
IC: 8773EFE VBAT: 3.7V CPU: 40M DVFS: Low Performance Power Mode: Active Mode Measuring Time: 10s |
LE Packet Receive (for MP) |
LE |
LE 1M PHY |
7.083 |
LE |
LE 2M PHY |
7.746 |
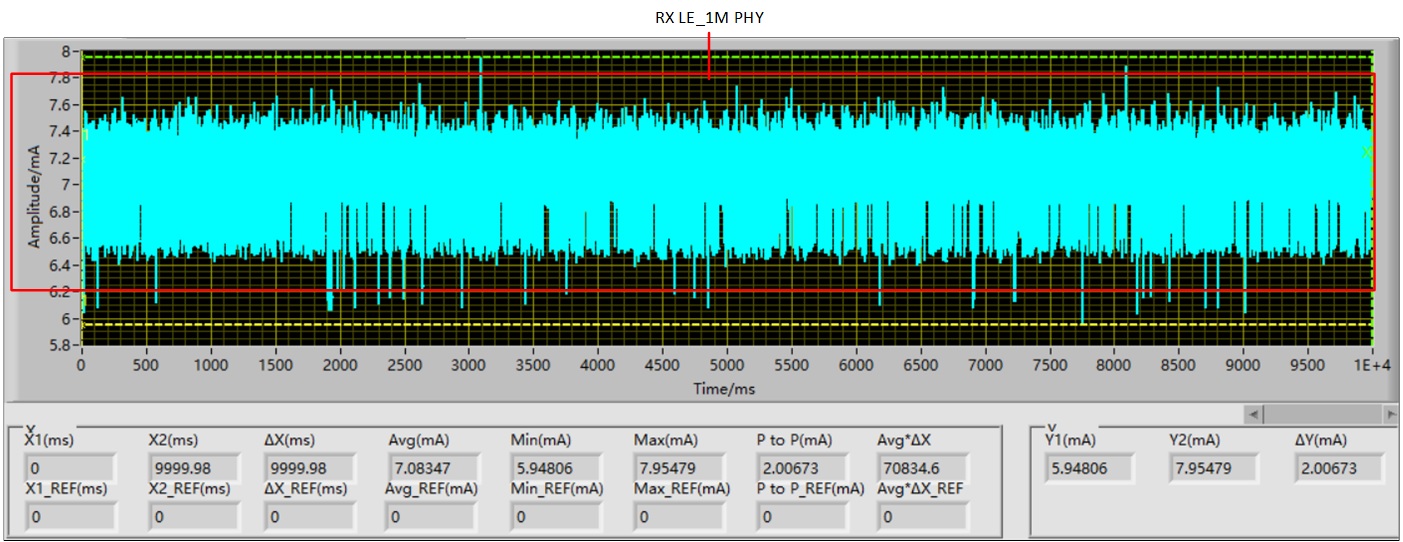
RX LE 1M
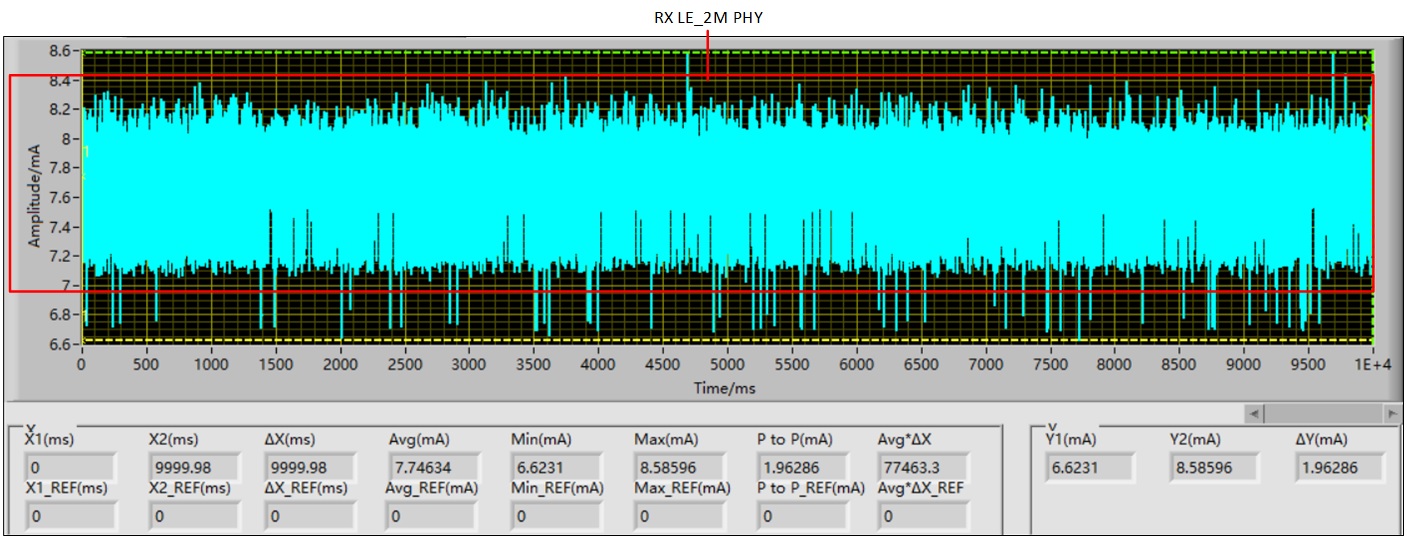
RX LE 2M
From the above results, the receive power consumption of LE 2M PHY is greater than LE 1M PHY.
RF Transmit Power
The RF transmit power is adjustable, with the range as follows.
Type |
Min (dbm) |
Max (dbm) |
|---|---|---|
BR |
-2 |
12 |
EDR_2M |
-2 |
10 |
EDR_3M |
-2 |
10 |
LE_1M |
-2 |
12.5 |
LE_2M |
-2 |
12.5 |
The power consumption increases as the transmit power setting increases.
RTL87x3E
Example:
Test Condition |
Continuous Transmit (for Certification) |
Transmit Power (dbm) |
Average Current (mA) |
Max Current (mA) |
|---|---|---|---|---|
|
IC: 8773EFE VBAT: 3.7V CPU: 40M DVFS: Low Performance Power Mode: Active Mode Measuring Time: 10s |
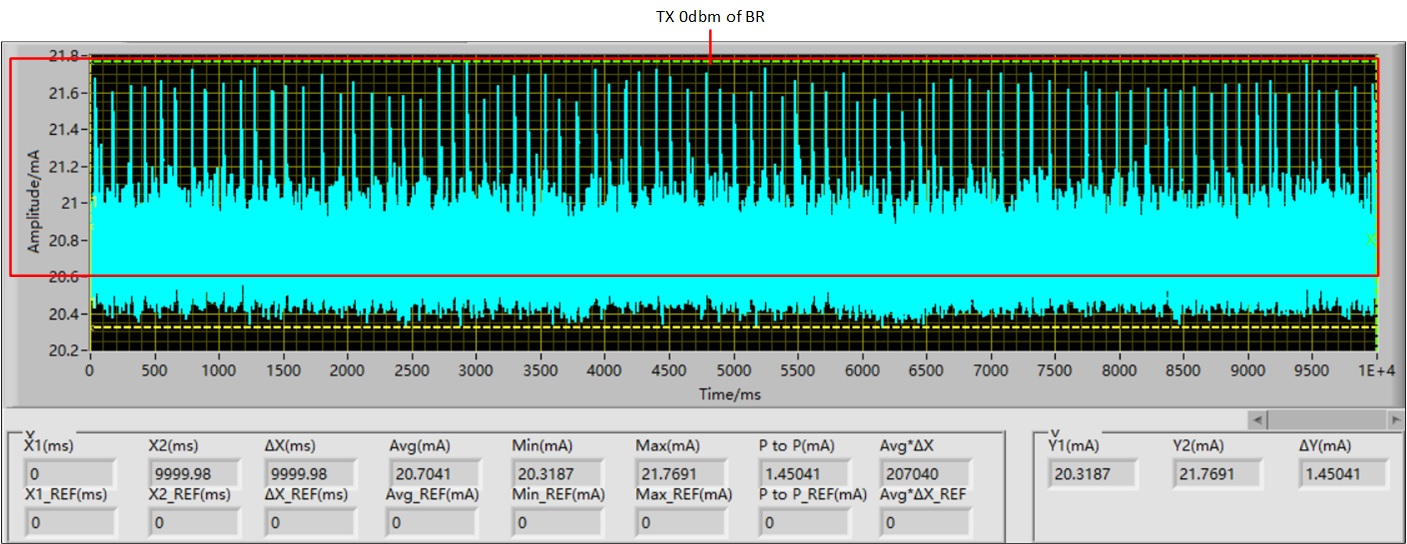
BR Channel: 0 Packet Type: DH5 Payload Type: PRBS9 |
0 |
20.704 |
21.769 |
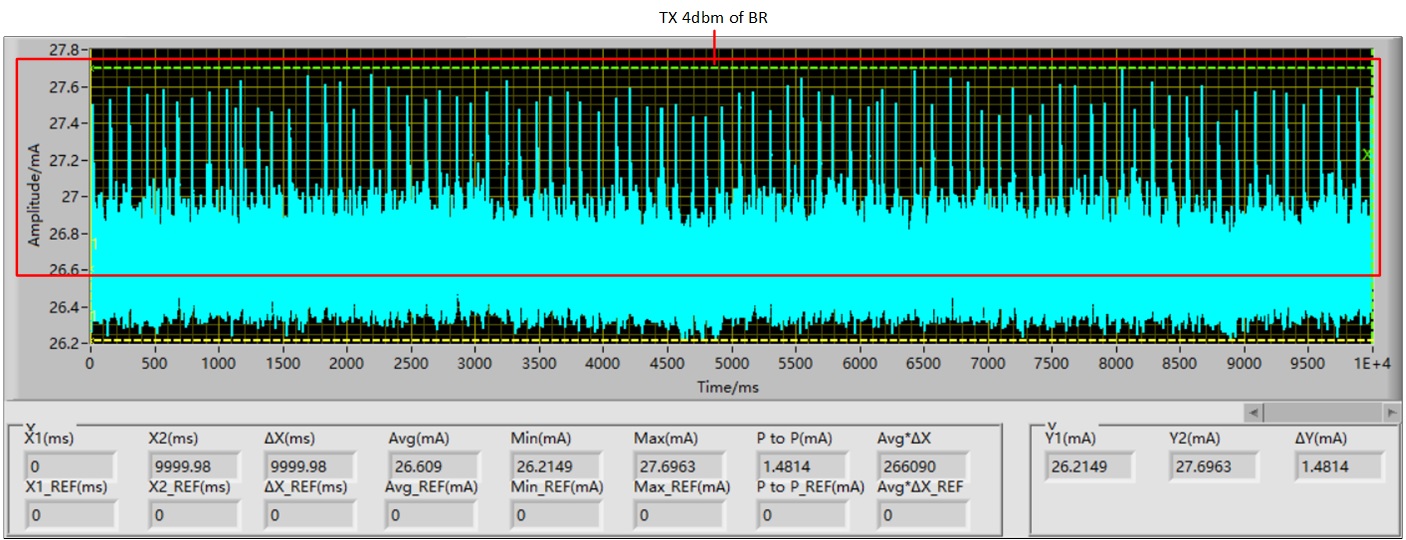
4 |
26.609 |
27.696 |
||
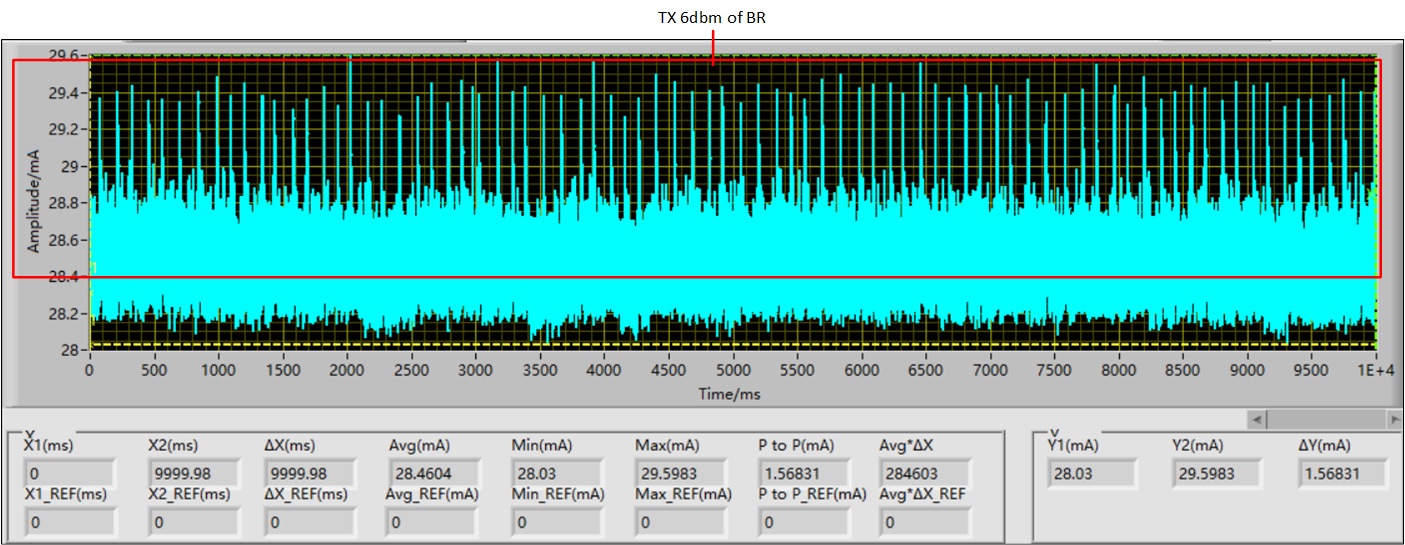
6 |
28.460 |
29.598 |
||
10 |
35.161 |
36.293 |
0dbm BR
4dbm BR
6dbm BR
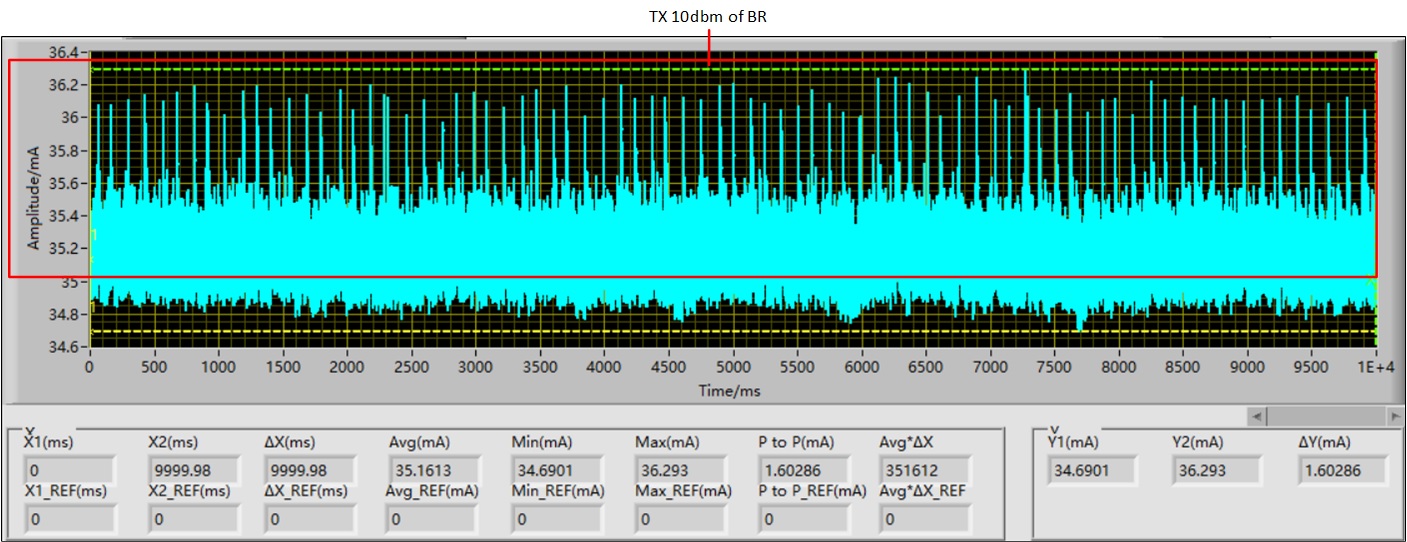
10dbm BR
Test Condition |
Continuous Transmit (for Certification) |
Transmit Power (dbm) |
Average Current (mA) |
Max Current (mA) |
|---|---|---|---|---|
|
IC: 8773EFE VBAT: 3.7V CPU: 40M DVFS: Low Performance Power Mode: Active Mode Measuring Time: 10s |
EDR_2M Channel: 0 Packet Type: 2DH5 Payload Type: PRBS9 |
0 |
20.680 |
21.765 |
4 |
26.431 |
27.534 |
||
6 |
28.368 |
29.458 |
||
10 |
34.630 |
36.030 |
Test Condition |
Continuous Transmit (for Certification) |
Transmit Power (dbm) |
Average Current (mA) |
Max Current (mA) |
|---|---|---|---|---|
|
IC: 8773EFE VBAT: 3.7V CPU: 40M DVFS: Low Performance Power Mode: Active Mode Measuring Time: 10s |
EDR_3M Channel: 0 Packet Type: 3DH5 Payload Type: PRBS9 |
0 |
20.687 |
21.749 |
4 |
26.428 |
27.554 |
||
6 |
28.381 |
29.631 |
||
10 |
34.602 |
35.822 |
Test Condition |
Continuous Transmit (for Certification) |
Transmit Power (dbm) |
Average Current (mA) |
Max Current (mA) |
|---|---|---|---|---|
|
IC: 8773EFE VBAT: 3.7V CPU: 40M DVFS: Low Performance Power Mode: Active Mode Measuring Time: 10s |
LE_1M Channel: 0 Packet Type: 3DH5 Payload Type: PRBS9 |
0 |
20.687 |
21.729 |
4 |
26.557 |
27.614 |
||
6 |
28.408 |
29.480 |
||
10 |
35.062 |
36.171 |
As observed from the current diagram above, increasing the setting of transmit power will result in a larger maximum current value, which will increase power consumption.
The transmit power consumption of BR/EDR_2M/EDR_3M/LE_1M is basically the same.
Bluetooth Low Energy State
Bluetooth Low Energy includes the following states:
Advertising
Scan
Connection
Advertising
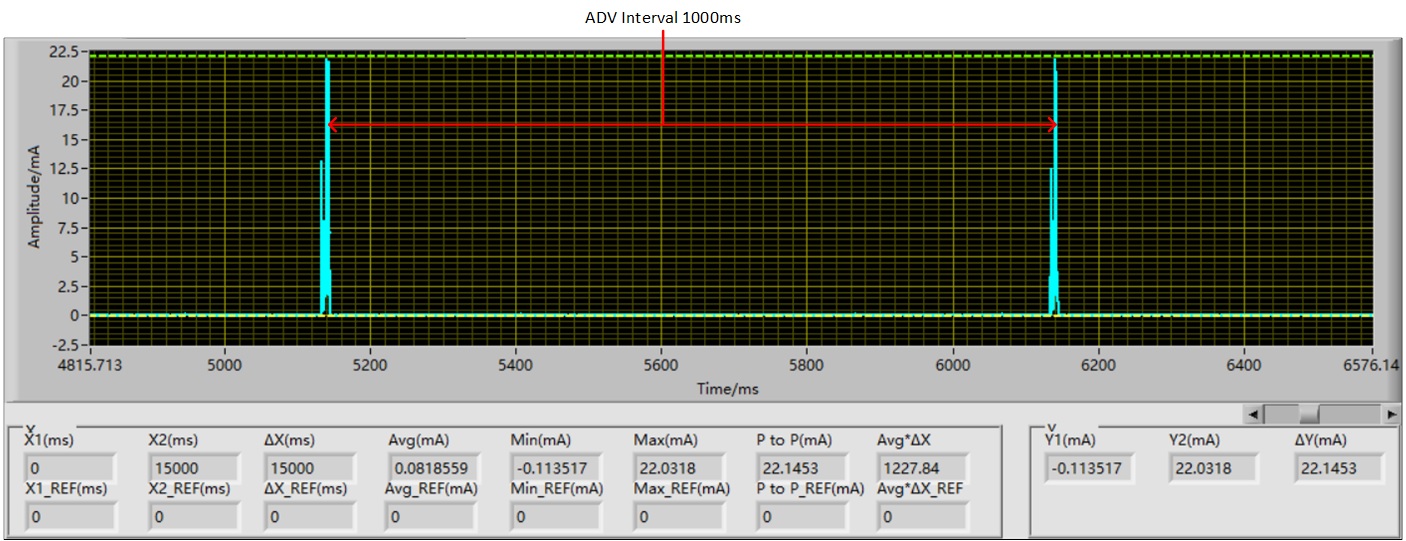
There are two main factors that affect the current consumption of advertising.
-
Advertising interval, range: 0x000020 to 0xFFFFFF, in units of 0.625ms.
The power consumption decreases while the interval increases.
-
Advertising data length, range: 0 to 31.
The power consumption increases while the length increases.
The following figure shows the current waveform of advertising.
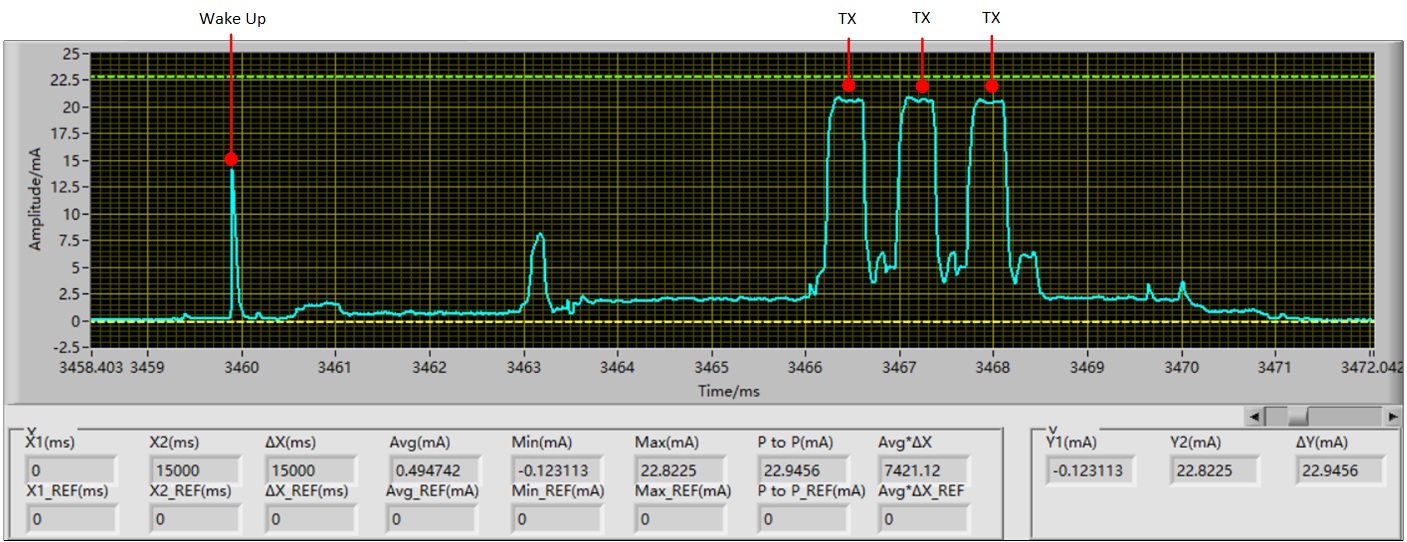
Advertising
If low power mode is enabled (as in most of the examples), the SoC can enter DLPS mode automatically between advertising events.
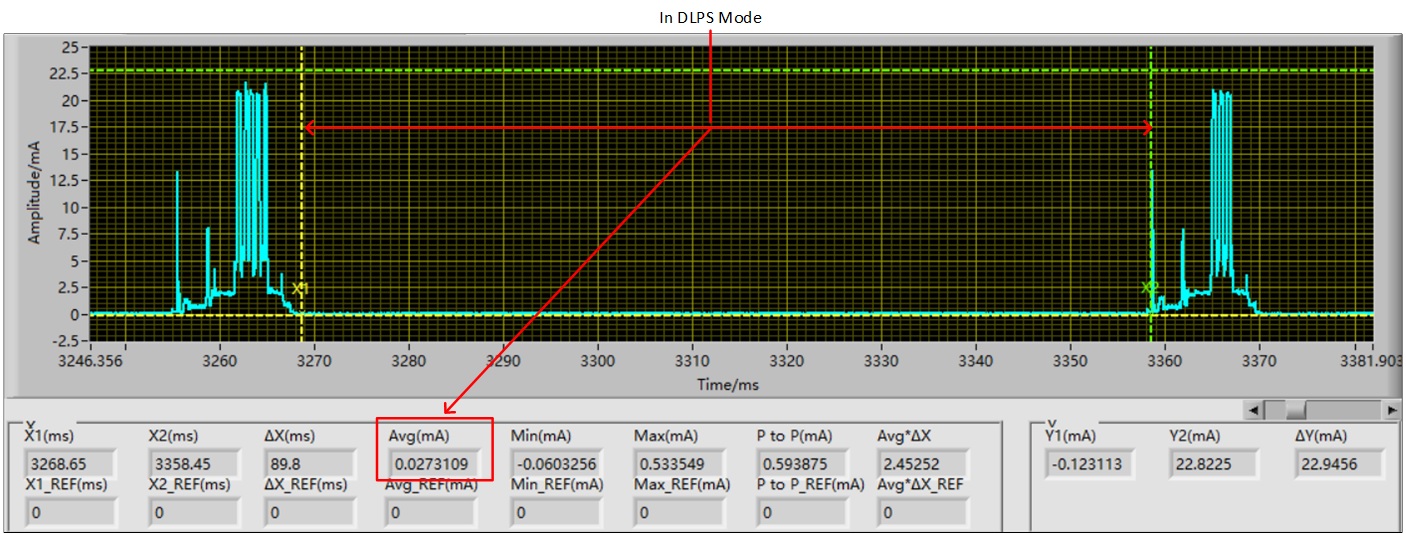
Advertising DLPS
RTL87x3E
Test results of RTL87x3E.
Different Advertising Interval
Example:
Test Condition |
Advertising Interval (ms) |
Current (uA) |
|---|---|---|
|
IC: 8773EFE VBAT: 3.7V CPU: 40M DVFS: Low Performance Power Mode: DLPS Mode Measuring Time: 15s Transmit Power: 0dbm Advertising Data Length: 31 |
100 |
495 |
300 |
194 |
|
500 |
125 |
|
1000 |
82 |
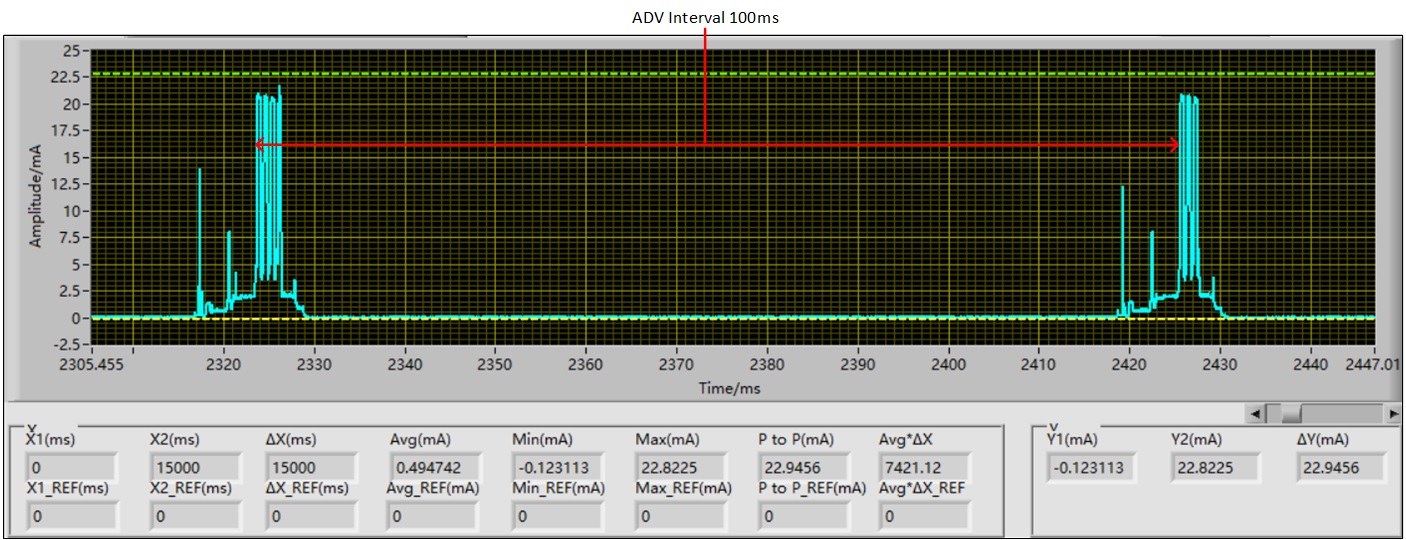
Advertising Interval 100ms
Advertising Interval 1000ms
Different Advertising Data Length
Example:
Test Condition |
Advertising Data Length |
Current (uA) |
|---|---|---|
|
IC: 8773EFE VBAT: 3.7V CPU: 40M DVFS: Low Performance Power Mode: DLPS Mode Measuring Time: 15s Transmit Power: 0dbm Advertising Interval: 100ms |
0 |
342 |
10 |
394 |
|
20 |
439 |
|
31 |
495 |
The larger the advertising data length, the greater the transmit duration.
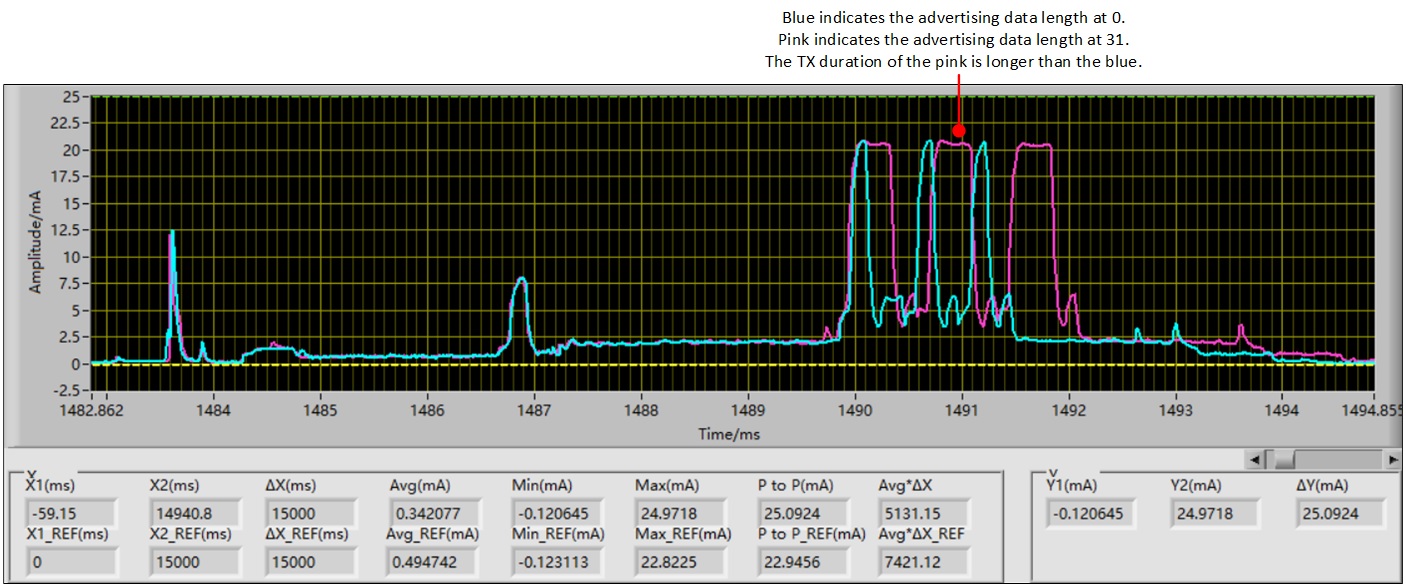
Advertising Date Length
Scan
There are four parameters in scan, and three of them impact power consumption.
-
Scan interval, range: 0x0004 to 0xFFFF, in units of 0.625ms.
The power consumption decreases while the interval increases.
-
Scan window, range: 0x0004 to 0xFFFF, in units of 0.625ms.
The power consumption increases while the window increases.
-
Scan mode: When there is external advertising, the active scan consumes more power.
Passive scan: No transmission is generated to reply when an external advertising is received.
Active scan: Transmission is generated to reply when an external advertising is received.
-
Duplicate: This parameter has no effect on power consumption.
Enable: Filter duplicate advertising, not report to host but still reply to advertising.
Disable: Do not filter duplicate advertising and reply to advertising.
The following figure shows the current waveform of scan.
Bluetooth Low Energy Scan
If low power mode is enabled (as in most of the examples), the SoC can enter DLPS mode automatically between scan events.
Bluetooth Low Energy Scan DLPS
RTL87x3E
Test results of RTL87x3E.
Different Scan Interval
Example:
Test Condition |
Scan Interval (ms) |
Current (uA) |
|---|---|---|
|
IC: 8773EFE VBAT: 3.7V CPU: 40M DVFS: Low Performance Power Mode: DLPS Mode Measuring Time: 15s Transmit Power: 0dbm Scan Window: 2.5ms Scan Mode: Passive Duplicate: Disable |
100 |
389 |
300 |
153 |
|
500 |
105 |
|
1000 |
69 |
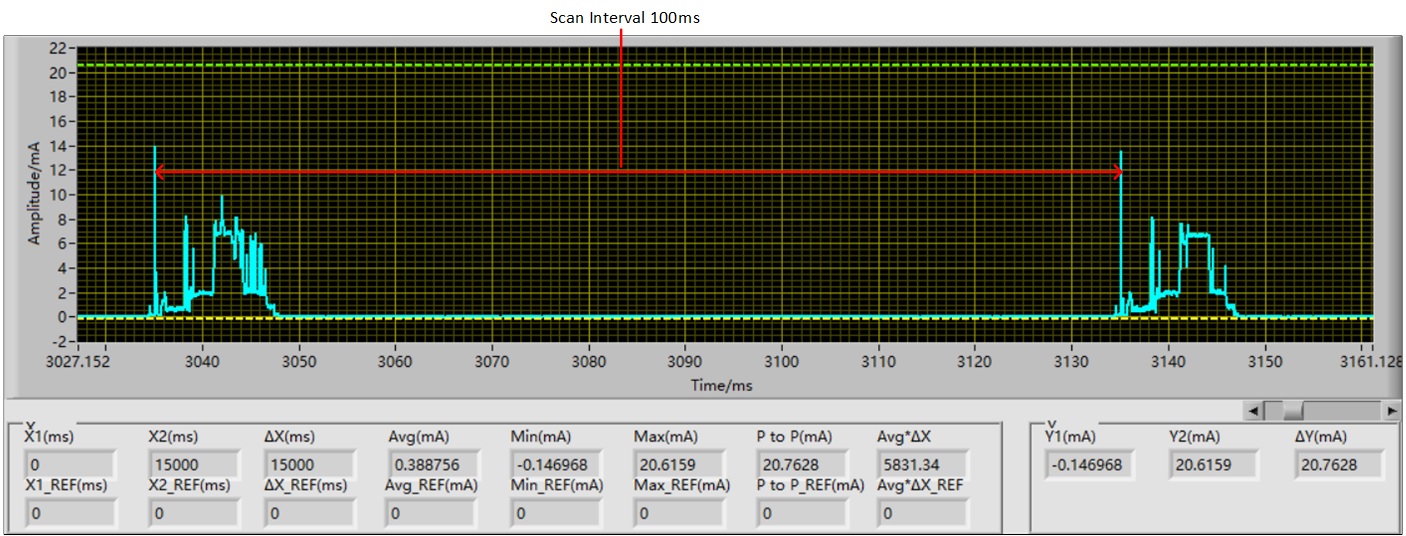
Bluetooth Low Energy Scan Interval 100ms
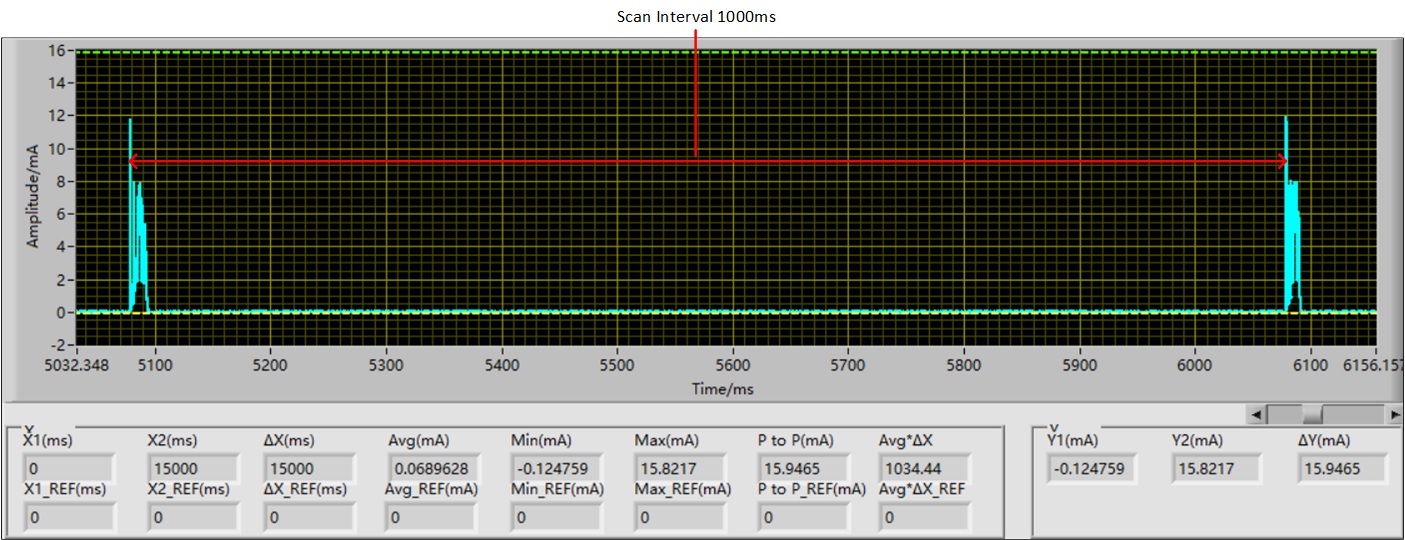
Bluetooth Low Energy Scan Interval 1000ms
Different Scan Window
Example:
Test Condition |
Scan Window (ms) |
Current (uA) |
|---|---|---|
|
IC: 8773EFE VBAT: 3.7V CPU: 40M DVFS: Low Performance Power Mode: DLPS Mode Measuring Time: 15s Transmit Power: 0dbm Scan Interval: 500ms Scan Mode: Passive Duplicate: Disable |
2.5 |
105 |
5 |
138 |
|
10 |
204 |
|
25 |
405 |
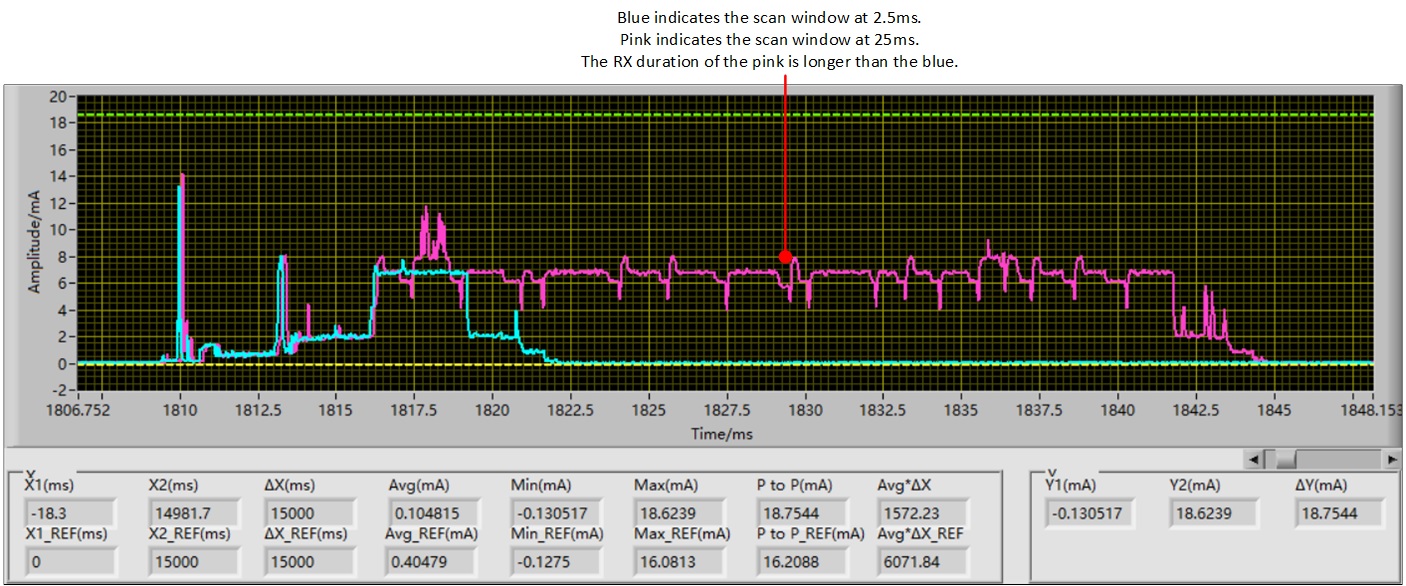
Bluetooth Low Energy Scan Window
Different Scan Mode
Example:
Test Condition |
Scan Mode |
Current (uA) |
|---|---|---|
|
IC: 8773EFE VBAT: 3.7V CPU: 40M DVFS: Low Performance Power Mode: DLPS Mode Measuring Time: 15s Transmit Power: 0dbm Scan Interval: 300ms Scan Window: 25ms Other Device Advertising Interval: 20ms Other Device Advertising Data Size: 23 Duplicate: Disable |
Passive |
645 |
Active |
665 |
The following figure shows the current waveform of Bluetooth Low Energy passive scan.
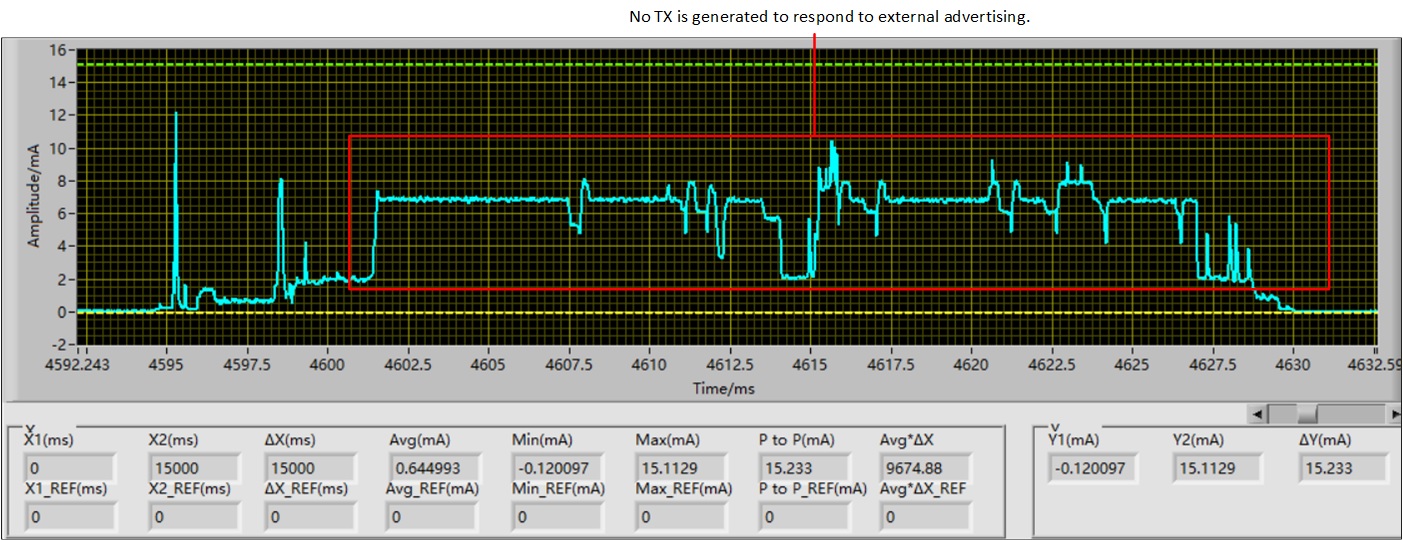
Bluetooth Low Energy Passive Scan
The following figure shows the current waveform of Bluetooth Low Energy active scan.
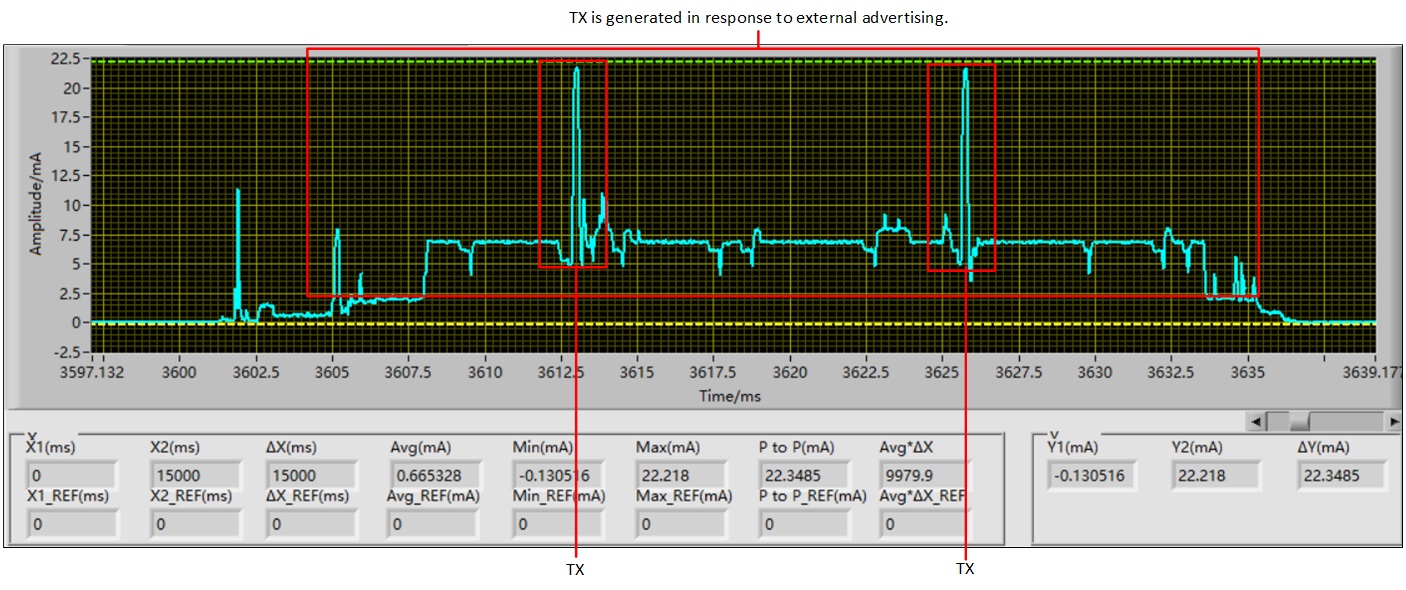
Bluetooth Low Energy Active Scan
Connection
There are two main factors affecting the current consumption of connection.
-
Connection interval, range: 0x0006 to 0x0C80, in units of 1.25ms.
The power consumption decreases while the interval increases.
-
Connection slave latency, range: 0x0000 to 0x01F3.
If there is no data interaction when serving as a slave, how many intervals can be skipped. The power consumption decreases while the latency increases.
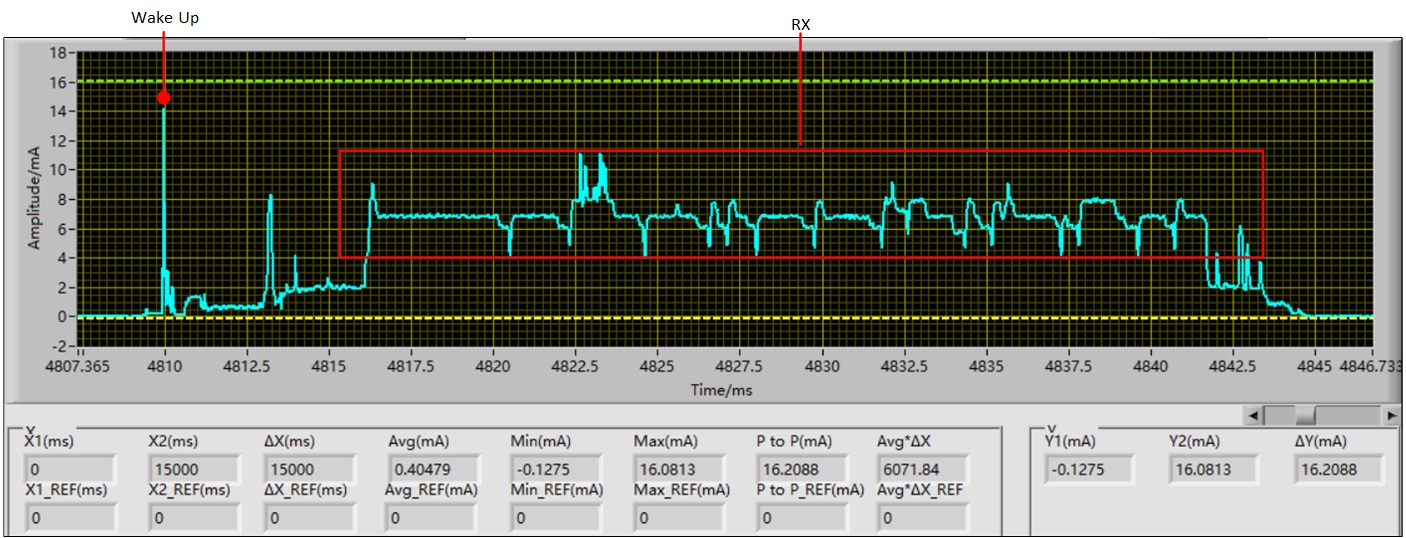
The following figure shows the current waveform of Bluetooth Low Energy connection.
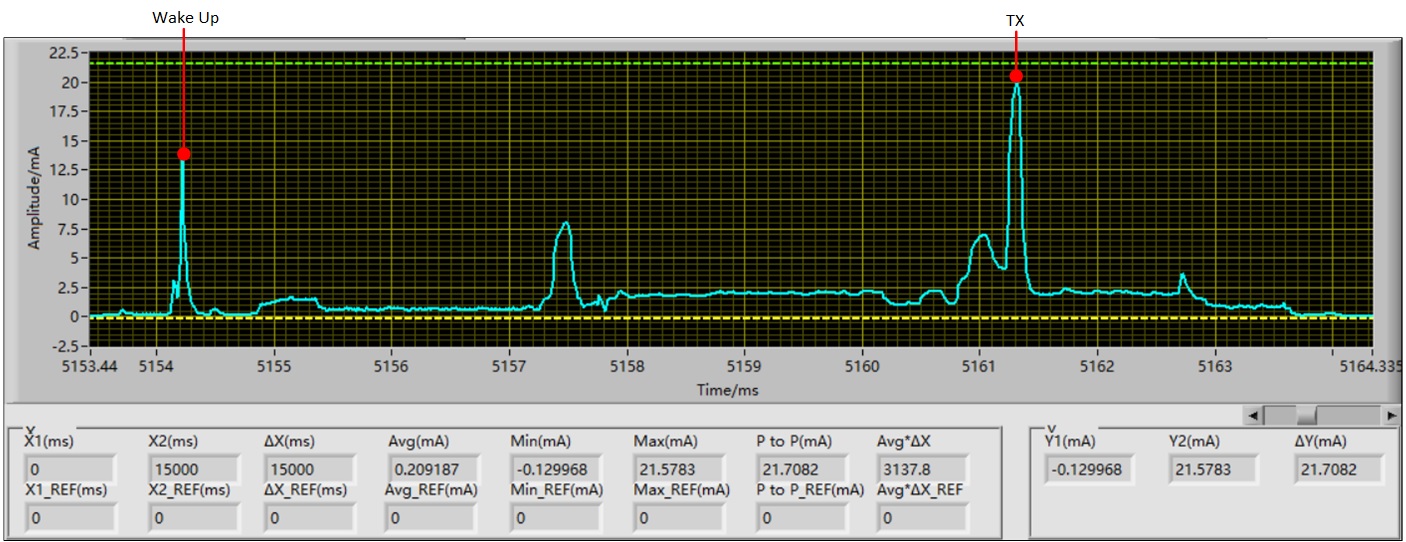
Bluetooth Low Energy Connect
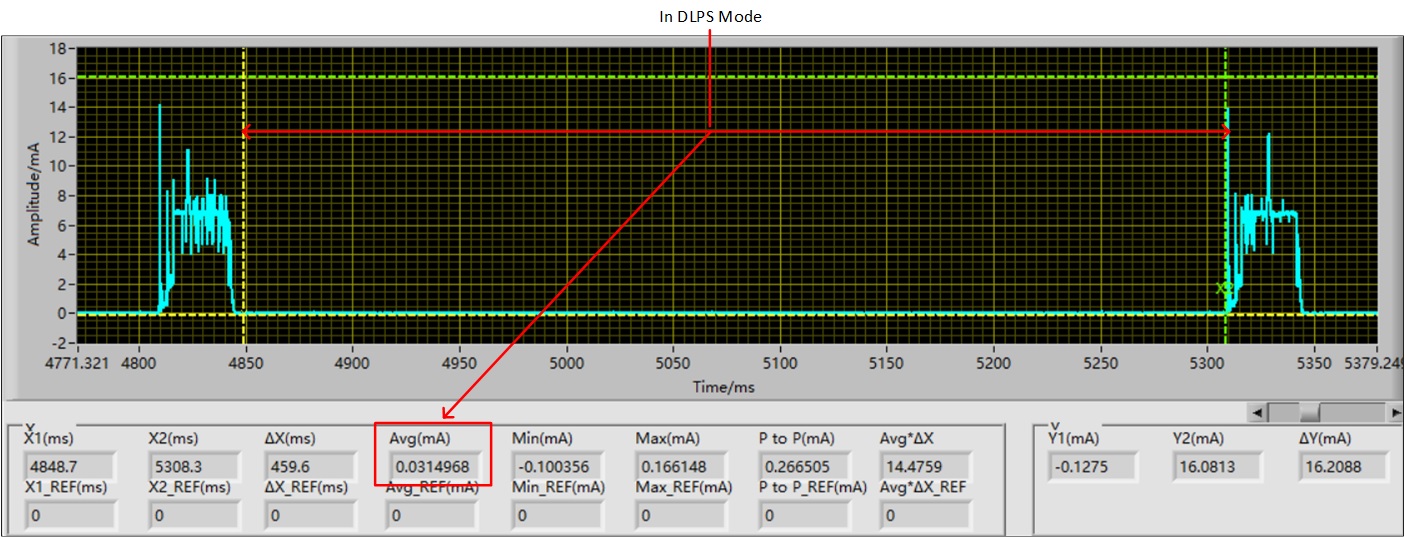
If low power mode is enabled (as in most of the examples), the SoC can enter DLPS mode automatically between connection events.

Bluetooth Low Energy Connect DLPS
RTL87x3E
Test results of RTL87x3E.
Different Connection Interval
Example:
Test Condition |
Connection Interval (ms) |
Current (uA) |
|---|---|---|
|
IC: 8773EFE VBAT: 3.7V CPU: 40M DVFS: Low Performance Power Mode: DLPS Mode Measuring Time: 15s Transmit Power: 0dbm Connection Slave Latency: 0 |
100 |
209 |
300 |
96 |
|
500 |
74 |
|
1000 |
57 |
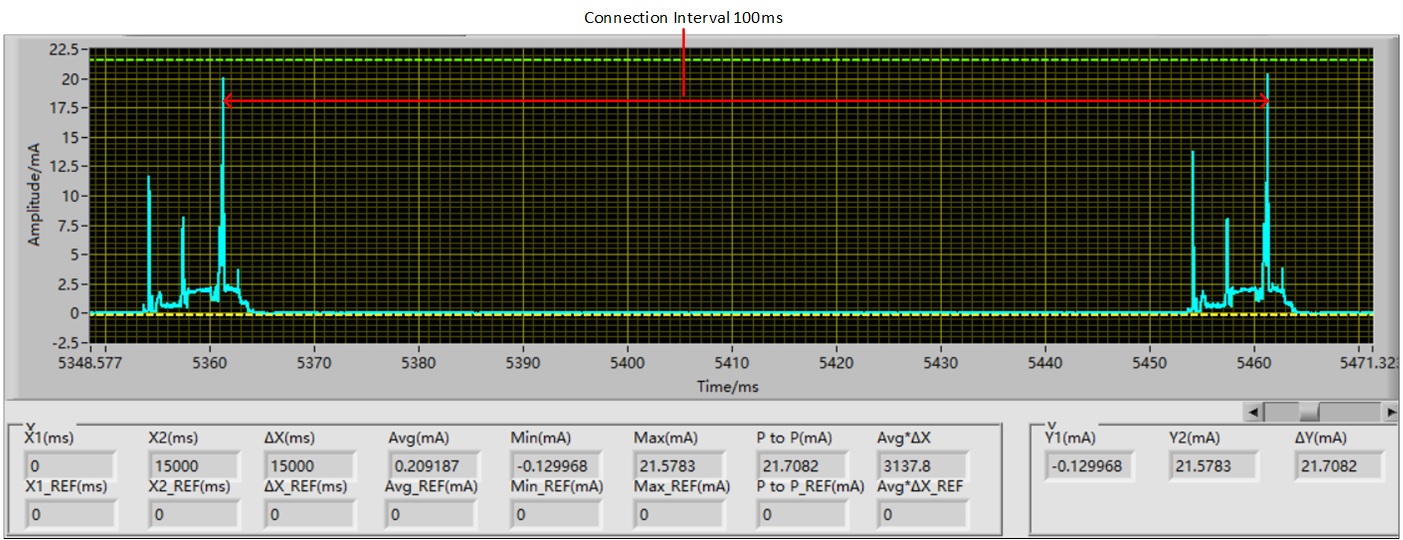
Bluetooth Low Energy Connect Interval 100ms
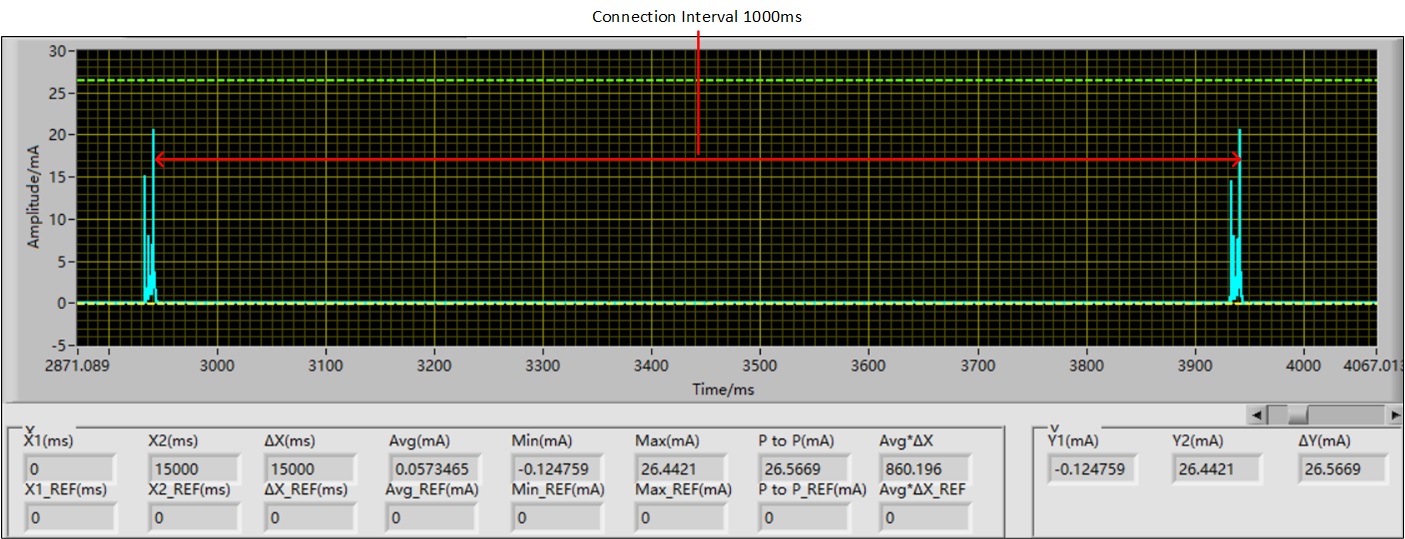
Bluetooth Low Energy Connect Interval 1000ms
Different Connection Slave Latency
Example:
Test Condition |
Connection Slave Latency |
Current (uA) |
|---|---|---|
|
IC: 8773EFE VBAT: 3.7V CPU: 40M DVFS: Low Performance Power Mode: DLPS Mode Measuring Time: 15s Transmit Power: 0dbm Connection Interval: 100ms |
0 |
209 |
1 |
124 |
|
2 |
103 |
|
3 |
90 |
The following figure shows the current waveform of Bluetooth Low Energy connection when setting the latency at 3.
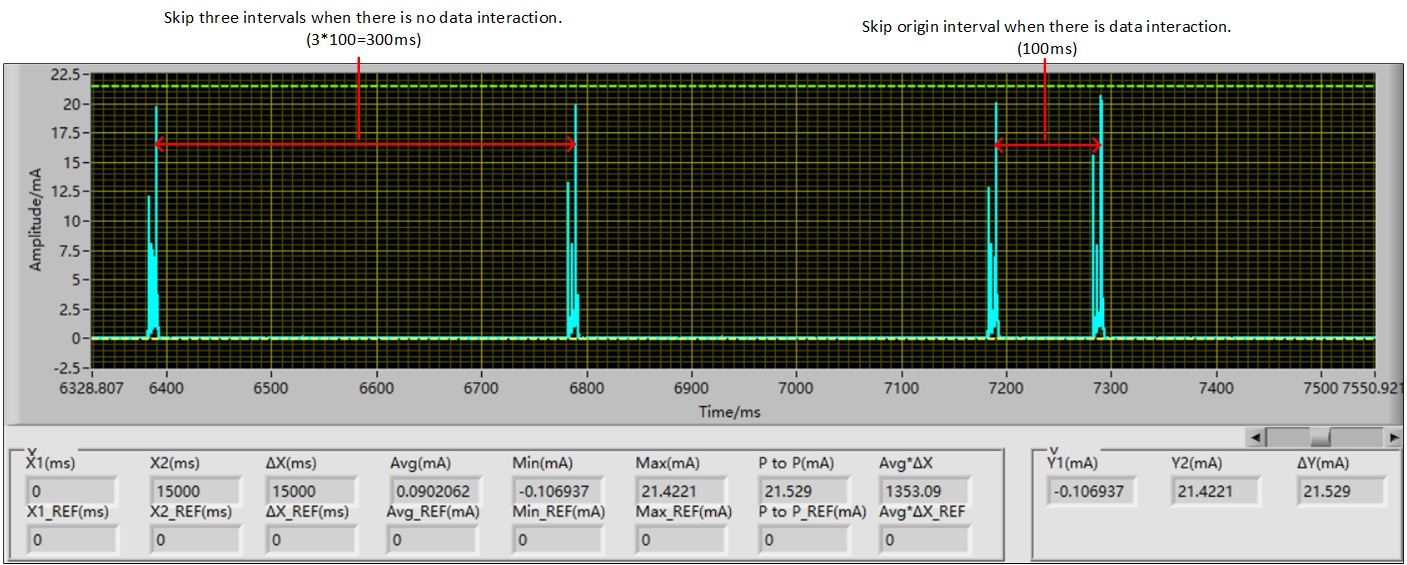
Bluetooth Low Energy Connect Latency 3
Bluetooth State
Bluetooth includes the following states:
Page Scan
Inquiry Scan
Sniff Mode
Page
Inquiry
Page Scan
There are four parameters in page scan, and three of them impact power consumption.
-
Page scan interval, range: 0x0012 to 0x1000, in units of 0.625ms, default 0x0800.
The power consumption decreases while the interval increases.
-
Page scan window, range: 0x0011 to 0x1000, in units of 0.625ms, default 0x0012.
The power consumption increases while the window increases.
-
Page scan type:
Standard
-
Interlace
During a standard scan, a device listens for the duration of the scan window (11.25ms default), while the generalized interlaced scan is performed as two back-to-back scan windows. Therefore, the interlace mode consumes more power.
Page timeout: how long to report a timeout error to the app when the connection is not possible. Therefore, the parameter has no influence on power consumption.
The following figure shows the current waveform of page scan.
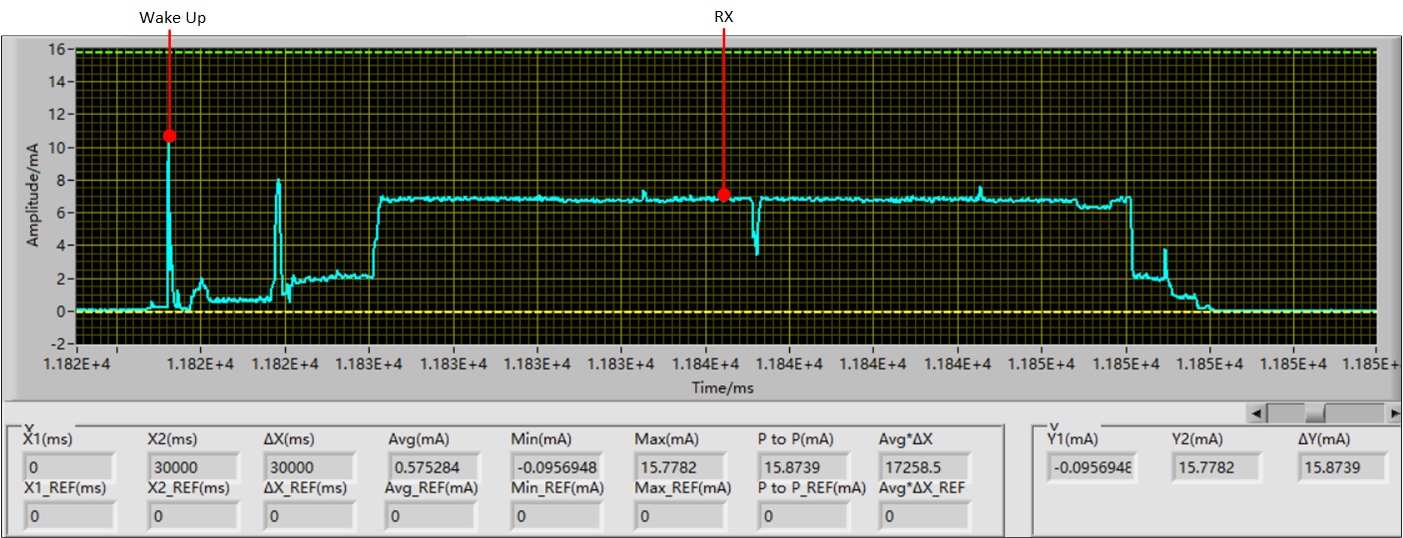
Bluetooth Page Scan
If low power mode is enabled (as in most of the examples), the SoC can enter DLPS mode automatically between page scan events.
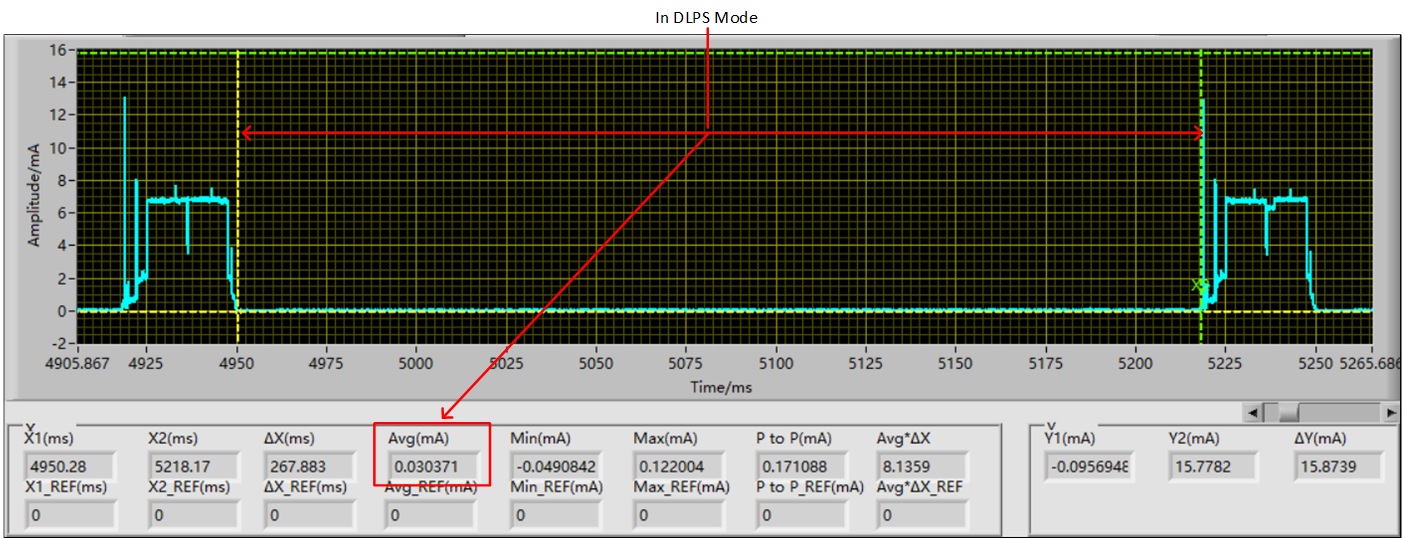
Bluetooth Page Scan DLPS
RTL87x3E
Test results of RTL87x3E.
Different Page Scan Interval
Example:
Test Condition |
Page Scan Interval (ms) |
Current (uA) |
|---|---|---|
|
IC: 8773EFE VBAT: 3.7V CPU: 40M DVFS: Low Performance Power Mode: DLPS Mode Measuring Time: 30s Transmit Power: 6dbm Page Scan Window: 11.25ms Page Scan Type: Interlace Page Timeout: 10240ms |
300 |
575 |
600 |
305 |
|
1280 |
162 |
|
2560 |
93 |
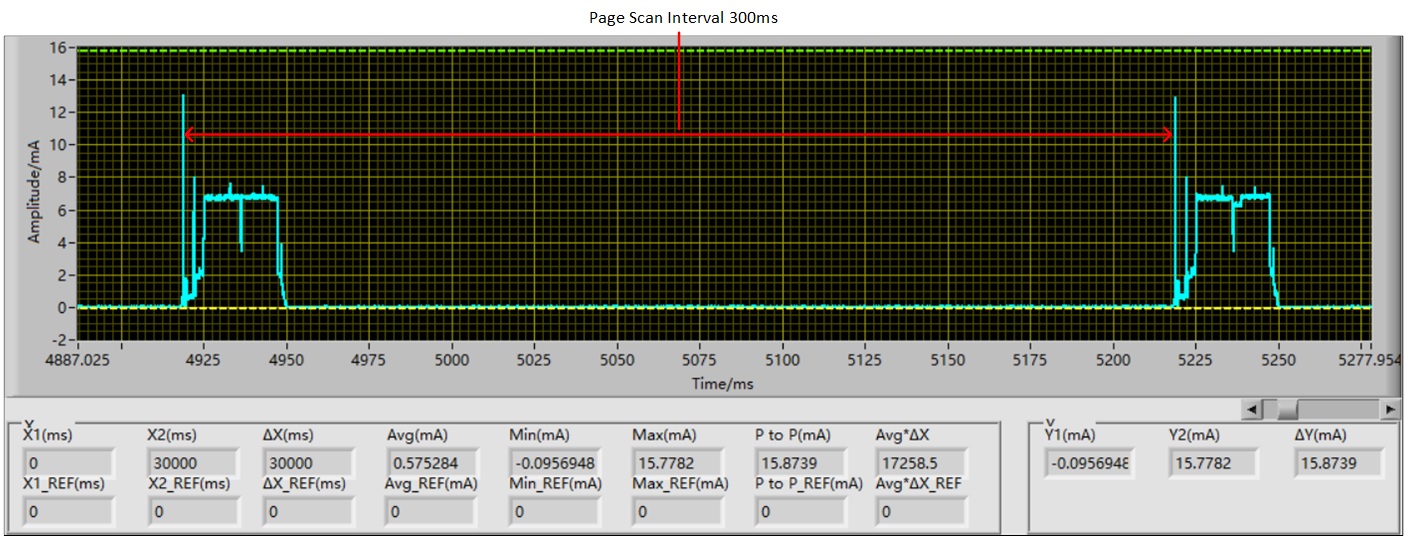
Bluetooth Page Scan Interval 300ms
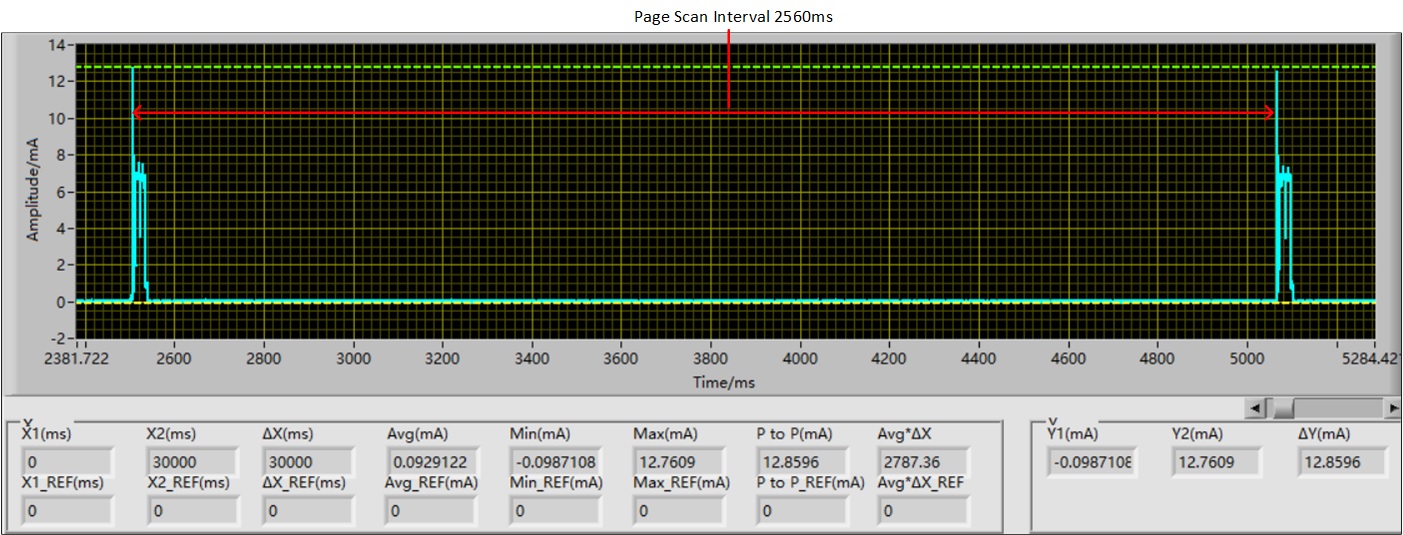
Bluetooth Page Scan Interval 2560ms
Different Page Scan Window
Example:
Test Condition |
Page Scan Window (ms) |
Current (uA) |
|---|---|---|
|
IC: 8773EFE VBAT: 3.7V CPU: 40M DVFS: Low Performance Power Mode: DLPS Mode Measuring Time: 30s Transmit Power: 6dbm Page Scan Interval: 1280ms Page Scan Type: Interlace Page Timeout: 10240ms |
11.25 |
162 |
20 |
249 |
|
25 |
299 |
|
30 |
368 |
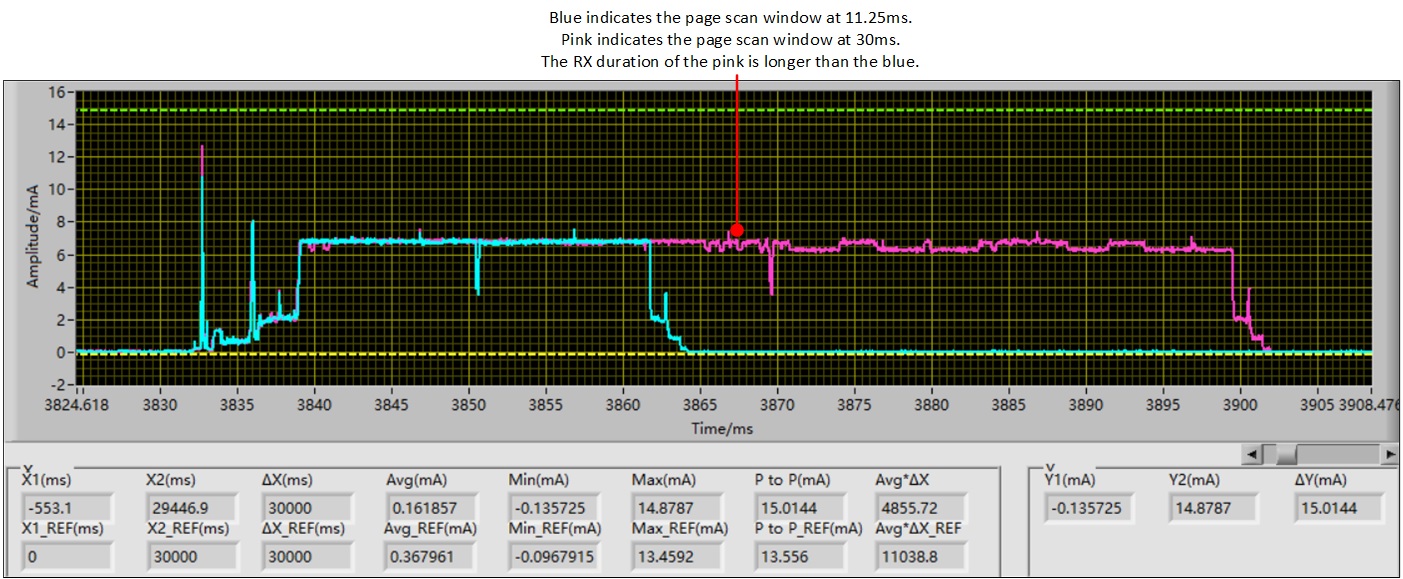
Bluetooth Page Scan Window
Different Page Scan Type
Example:
Test Condition |
Page Scan Type |
Current (uA) |
|---|---|---|
|
IC: 8773EFE VBAT: 3.7V CPU: 40M DVFS: Low Performance Power Mode: DLPS Mode Measuring Time: 30s Transmit Power: 6dbm Page Scan Interval: 1280ms Page Scan Window: 11.25ms Page Timeout: 10240ms |
Interlace |
162 |
Standard |
104 |
The following figure shows the current waveform of interlace page scan.
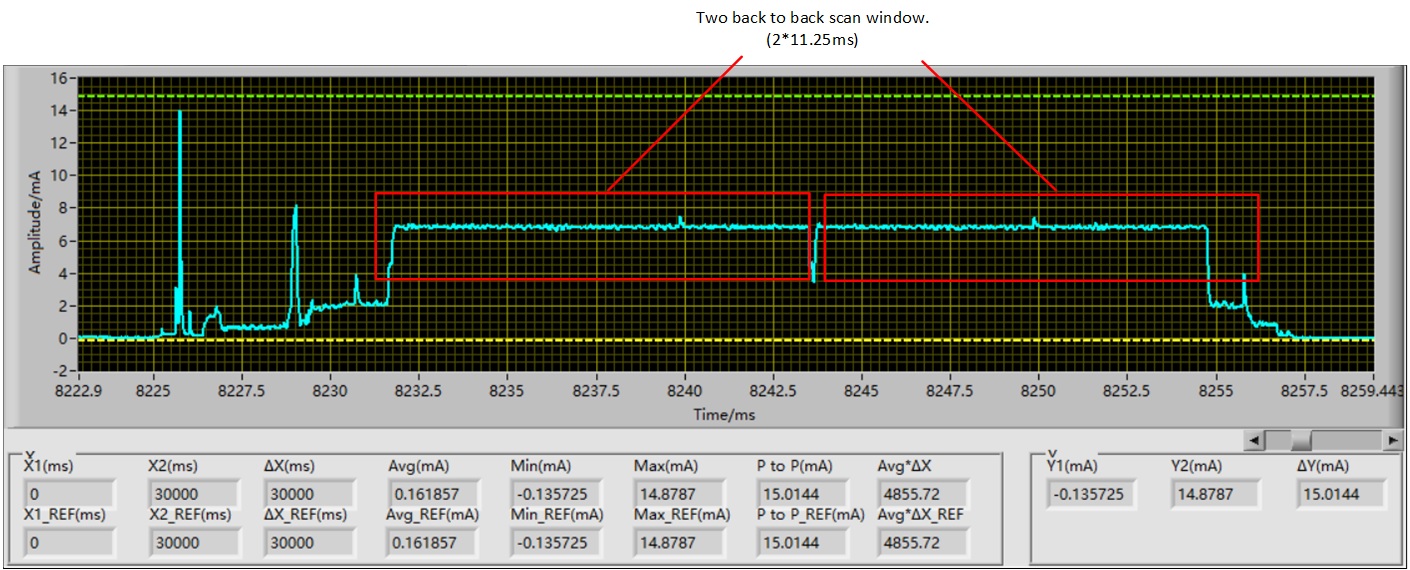
Bluetooth Interlace Page Scan
The following figure shows the current waveform of standard page scan.
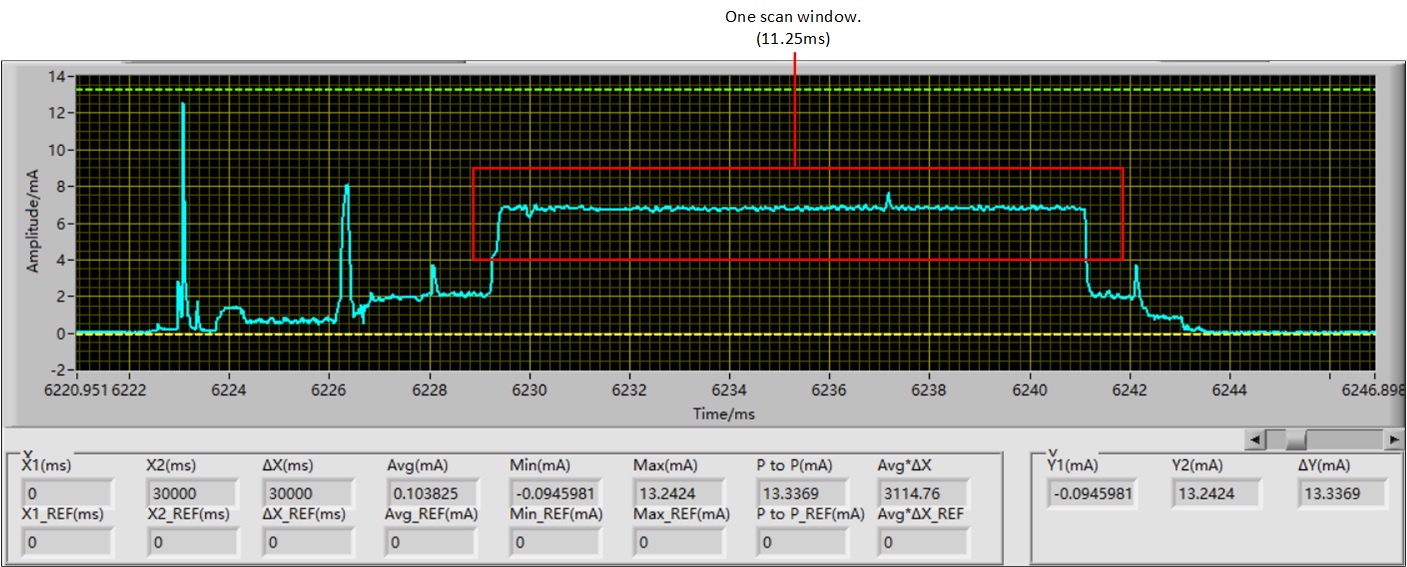
Bluetooth Standard Page Scan
Inquiry Scan
There are three main factors that affect current consumption of inquiry scan.
-
Inquiry scan interval, range: 0x0012 to 0x1000, in units of 0.625ms, default 0x1000.
The power consumption decreases while the interval increases.
-
Inquiry scan window, range: 0x0011 to 0x1000, in units of 0.625ms, default 0x0012.
The power consumption increases while the window increases.
-
Inquiry scan type:
Standard
-
Interlace
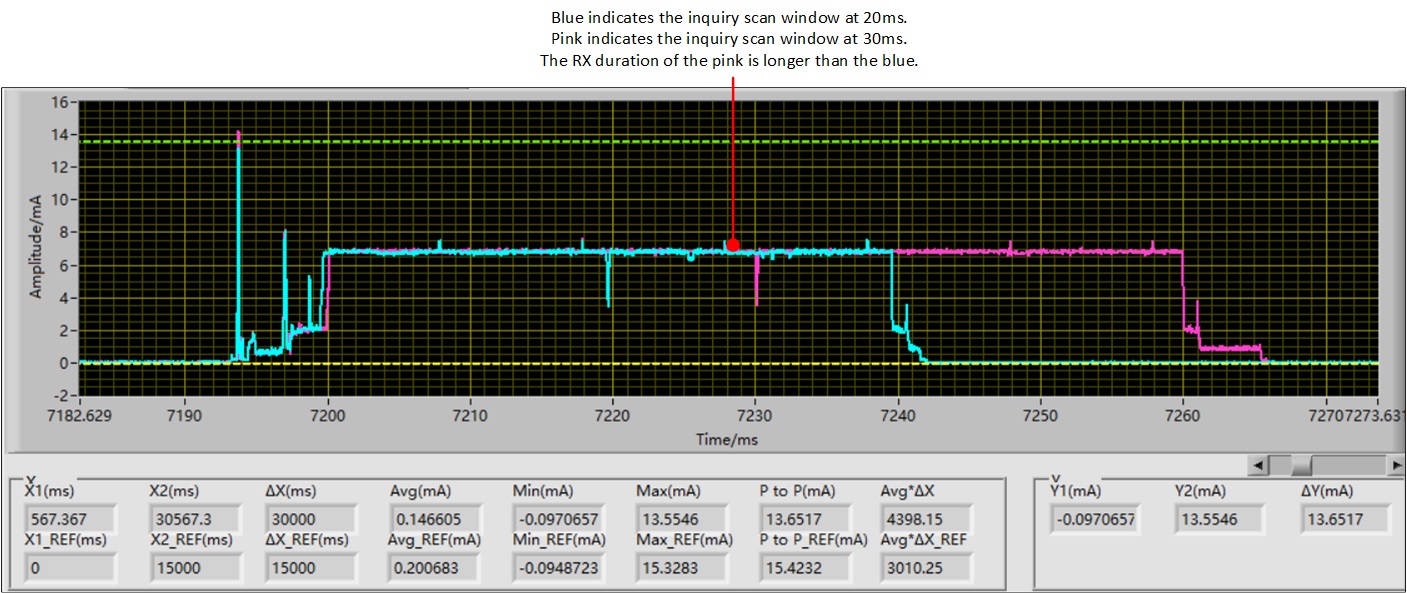
During a standard scan, a device listens for the duration of the scan window (11.25ms default), while the generalized interlaced scan is performed as two back-to-back scan windows. Therefore, the interlace mode consumes more power.
Note
Since inquiry scan will generate a transmission when it finds another device, the following test results will have higher power consumption than testing in a shielded room.
The following figure shows the current waveform of inquiry scan.
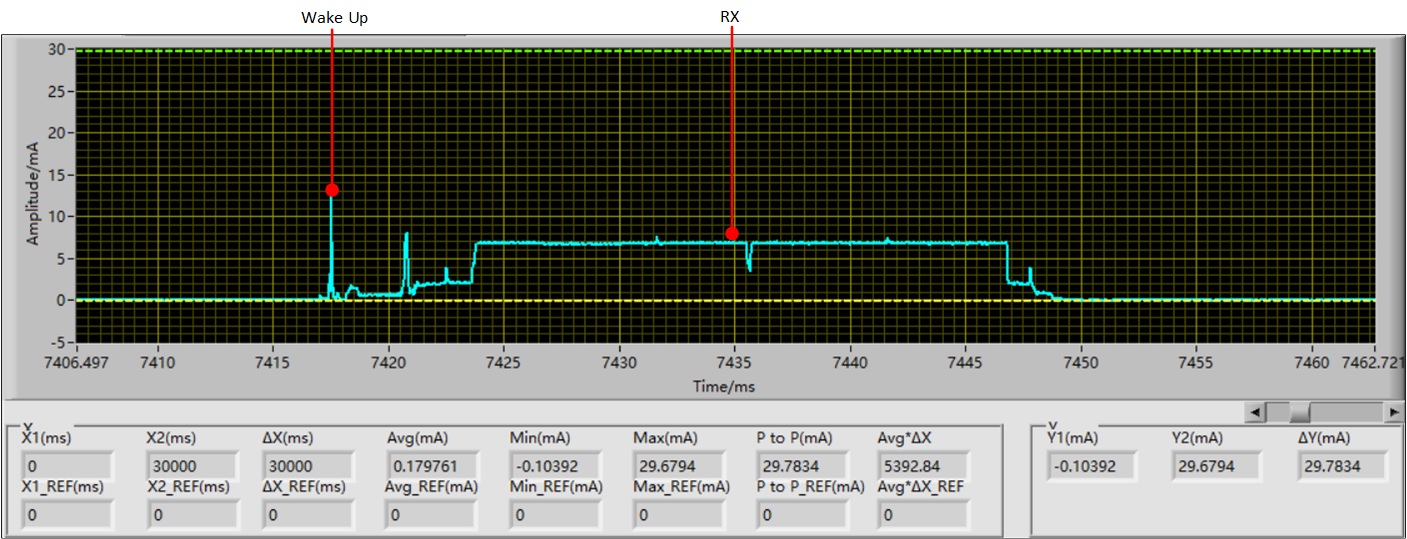
Bluetooth Inquiry Scan
If low power mode is enabled (as in most of the examples), the SoC can enter DLPS mode automatically between inquiry scan events.
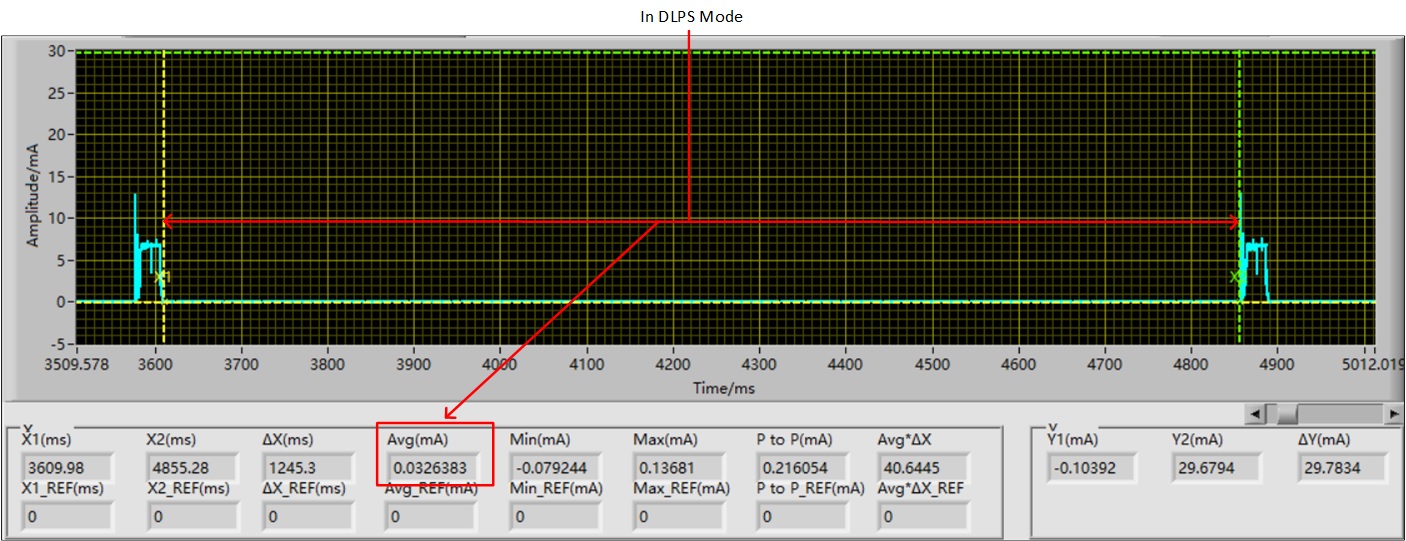
Bluetooth Inquiry Scan DLPS
RTL87x3E
Test results of RTL87x3E.
Different Inquiry Scan Interval
Example:
Test Condition |
Inquiry Scan Interval (ms) |
Current (uA) |
|---|---|---|
|
IC: 8773EFE VBAT: 3.7V CPU: 40M DVFS: Low Performance Power Mode: DLPS Mode Measuring Time: 30s Transmit Power: 6dbm Inquiry Scan Window: 11.25ms Inquiry Scan Type: Interlace |
300 |
607 |
600 |
328 |
|
1280 |
180 |
|
2560 |
105 |
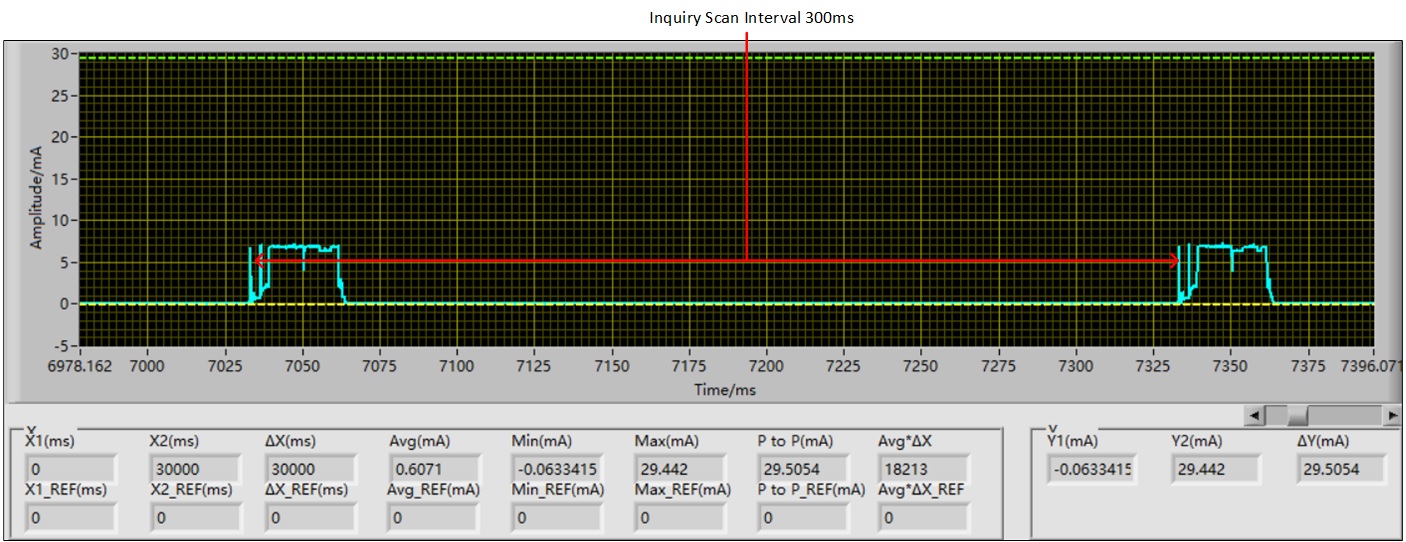
Bluetooth Inquiry Scan Interval 300ms
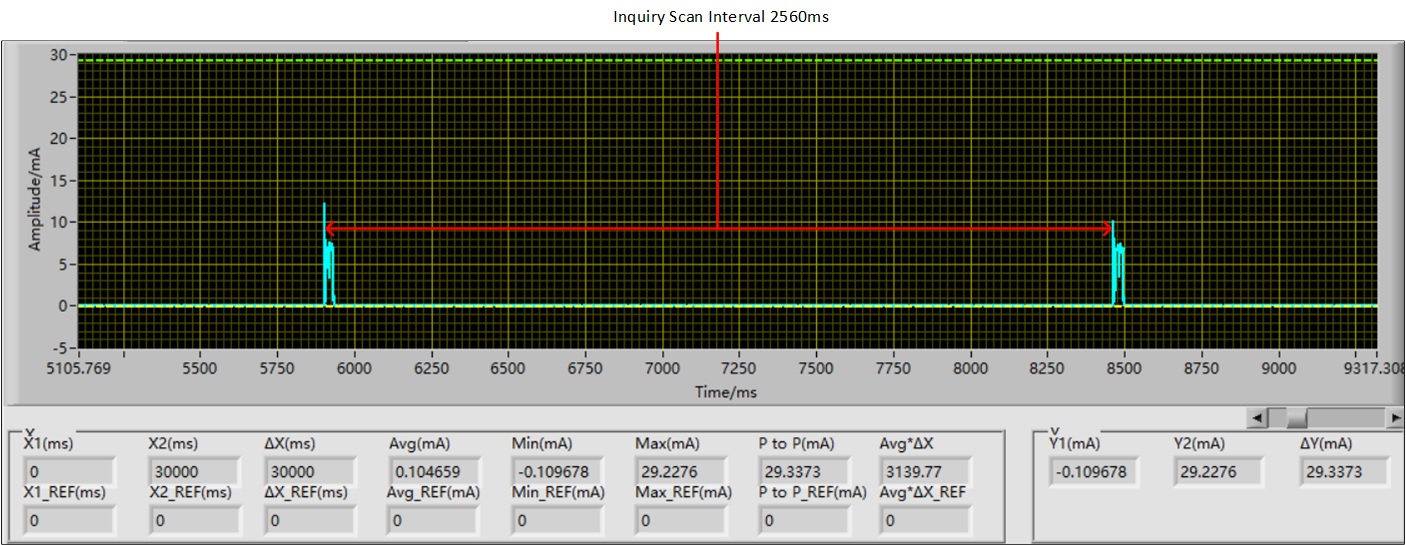
Bluetooth Inquiry Scan Interval 2560ms
Different Inquiry Scan Window
Example:
Test Condition |
Inquiry Scan Window (ms) |
Current (uA) |
|---|---|---|
|
IC: 8773EFE VBAT: 3.7V CPU: 40M DVFS: Low Performance Power Mode: DLPS Mode Measuring Time: 30s Transmit Power: 6dbm Inquiry Scan Interval: 2560ms Inquiry Scan Type: Interlace |
11.25 |
105 |
20 |
147 |
|
25 |
174 |
|
30 |
201 |
Bluetooth Inquiry Scan Window
Different Inquiry Scan Type
Example:
Test Condition |
Inquiry Scan Type |
Current (uA) |
|---|---|---|
|
IC: 8773EFE VBAT: 3.7V CPU: 40M DVFS: Low Performance Power Mode: DLPS Mode Measuring Time: 30s Transmit Power: 6dbm Inquiry Scan Interval: 2560ms Inquiry Scan Window: 11.25ms |
Interlace |
105 |
Standard |
70 |
The following figure shows the current waveform of interlace inquiry scan.
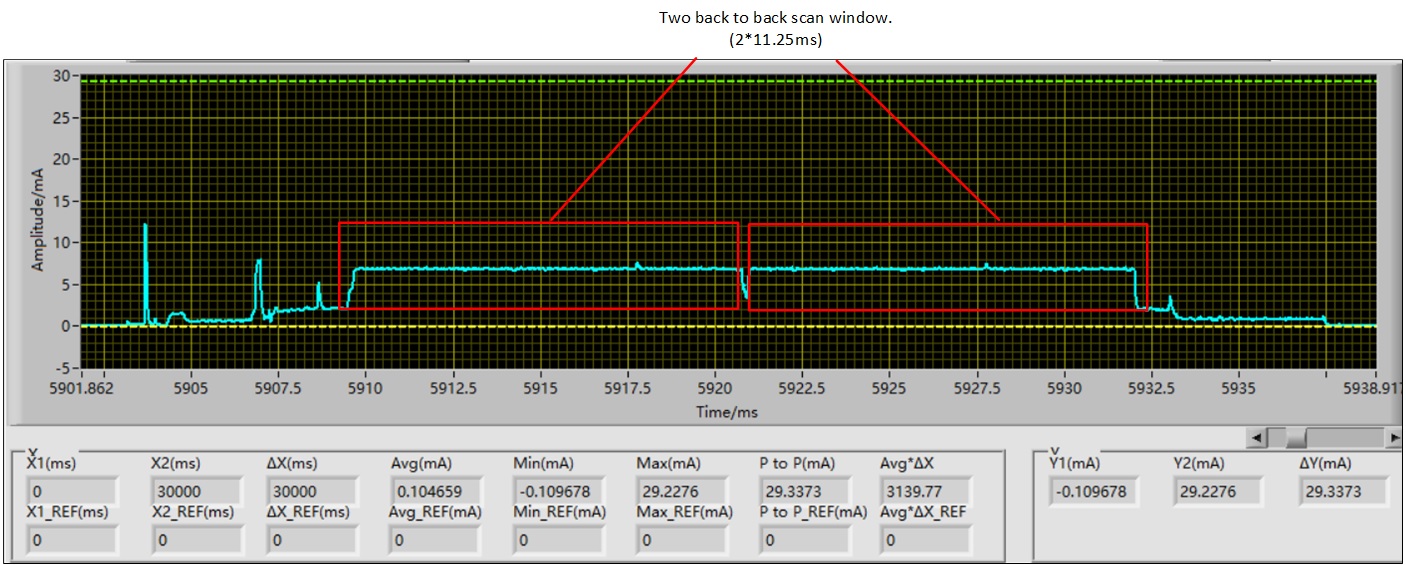
Bluetooth Interlace Inquiry Scan
The following figure shows the current waveform of standard inquiry scan.
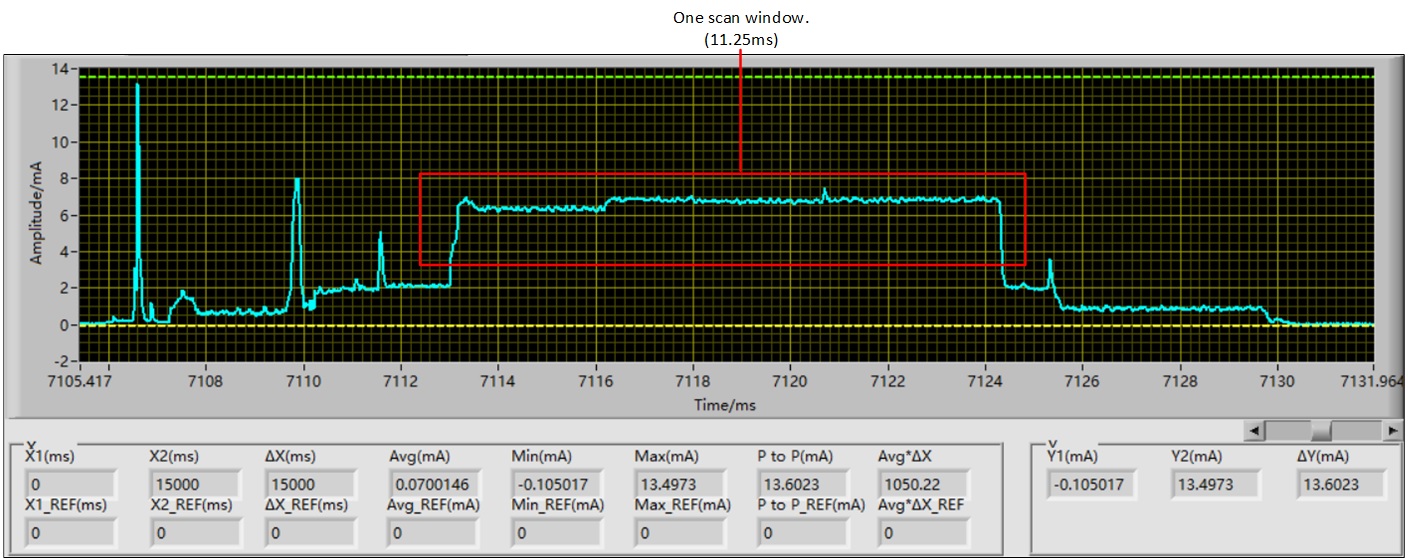
Bluetooth Standard Inquiry Scan
Sniff Mode
There are three main factors that affect current consumption of sniff mode.
-
Sniff mode interval, range: 0x0002 to 0xFFFE, in units of 0.625ms.
The power consumption decreases while the interval increases.
-
Sniff mode attempt, range: 0x0001 to 0x7FFF, in units of 1.25ms.
The power consumption increases while the sniff mode attempt increases.
-
Sniff mode timeout, range: 0x0000 to 0x7FFF, in units of 1.25ms.
The power consumption increases while the sniff mode timeout increases.
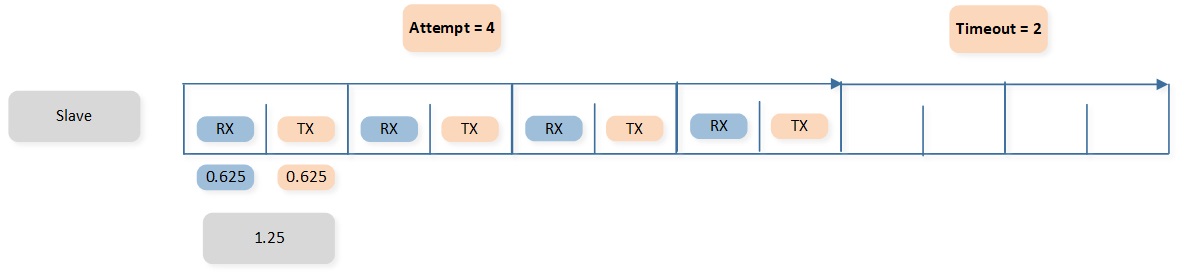
Bluetooth Sniff Mode Slave Attempt Timeout
A slot has an interval of 0.625ms and normally contains a transmission or a reception. The interval of an attempt is 1.25ms, so one attempt contains two slots. Timeout is the slots that are required to be waited when data is received. During the attempt period, the master will generate a transmission in each attempt. Therefore, the slave will generate a reception and then generate a transmission to reply.
Note
When the attempt or timeout is set to a large value, it will affect the situation of multi-link. Therefore, in the SoC, if the attempt or timeout exceeds 10, the attempt will be set to 4 and the timeout will be set to 2.
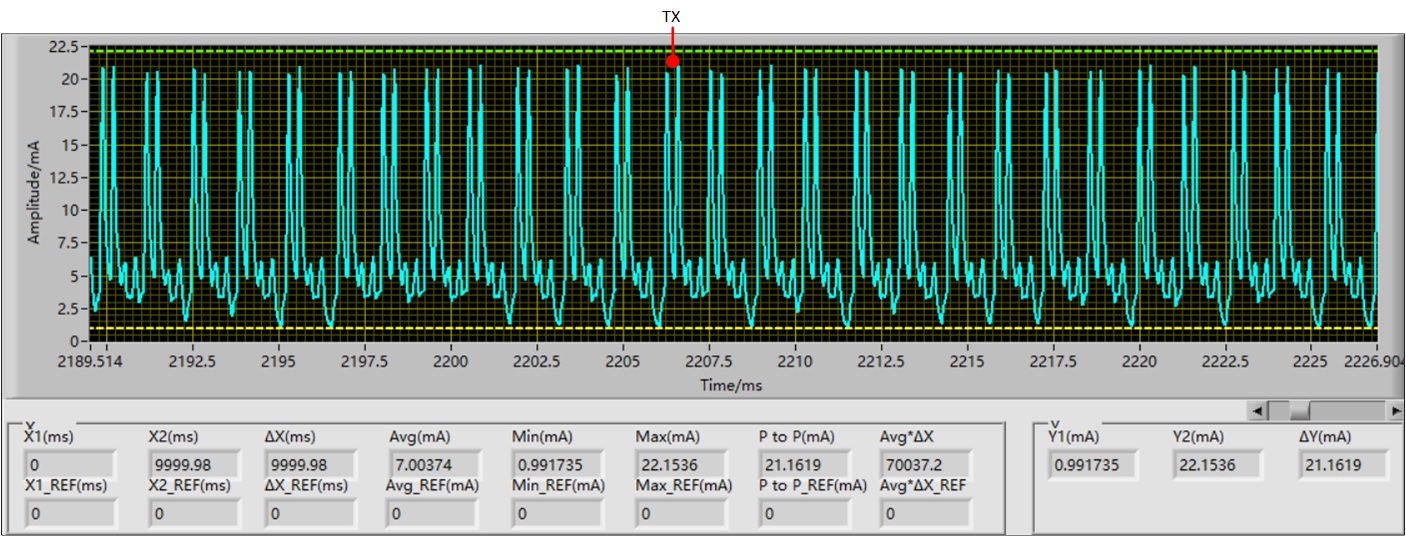
The following figure shows the current waveform of sniff mode.
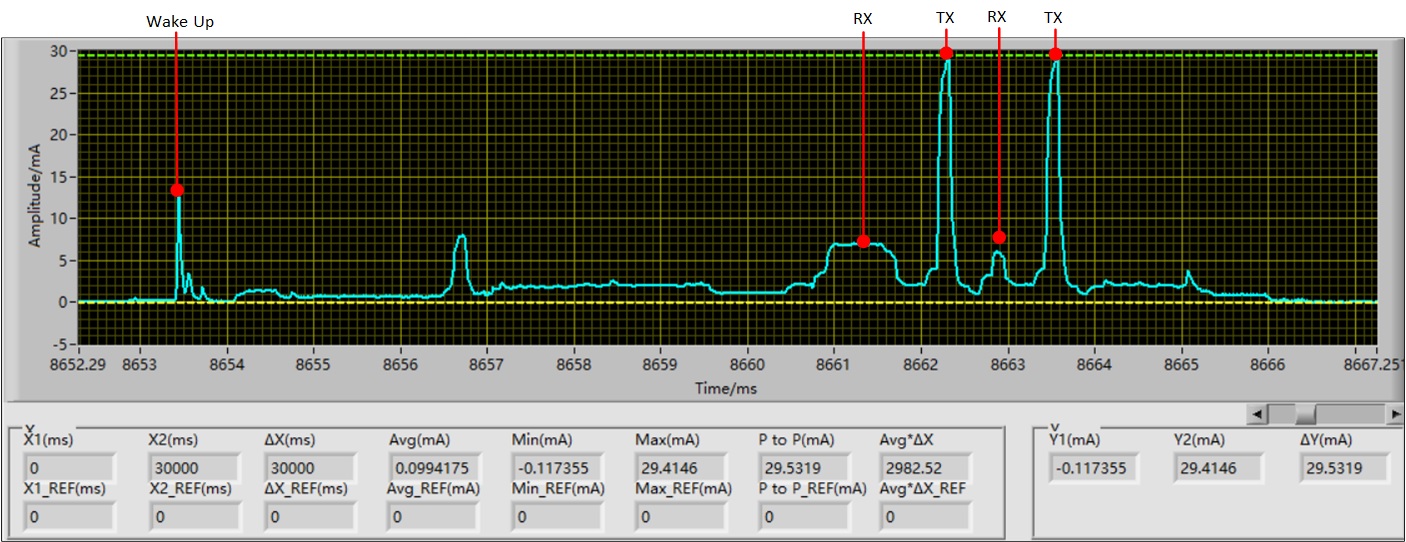
Bluetooth Sniff Mode
If low power mode is enabled (as in most of the examples), the SoC can enter DLPS mode automatically between sniff mode events.
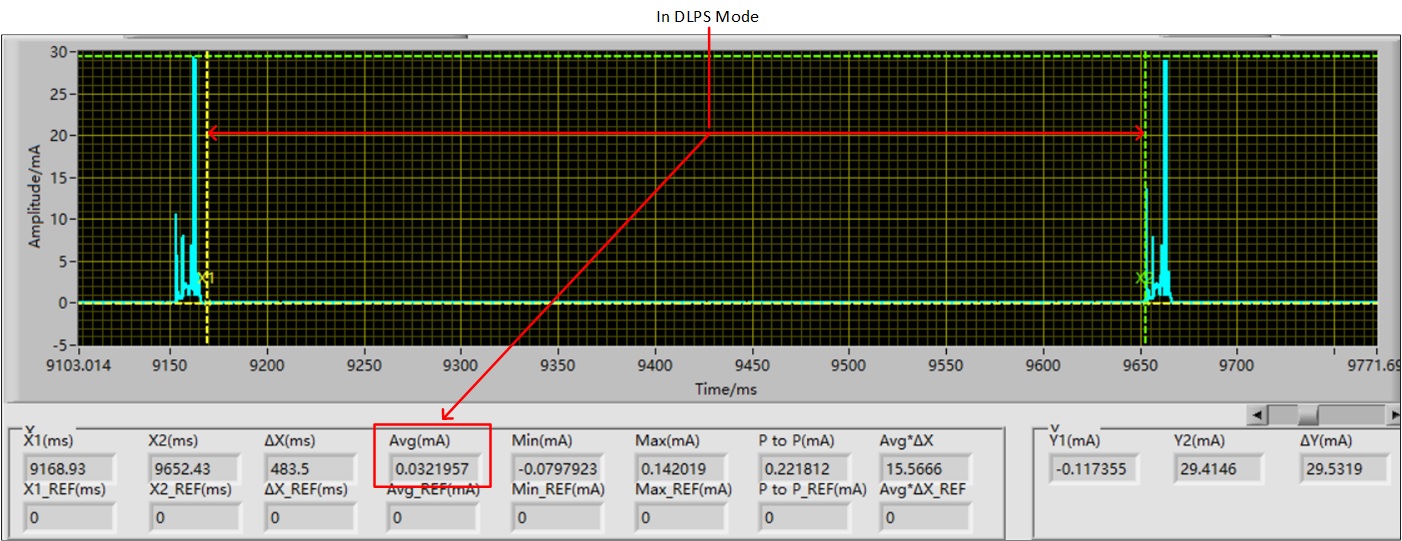
Bluetooth Sniff Mode DLPS
RTL87x3E
Test results of RTL87x3E.
Different Sniff Mode Interval
Example:
Test Condition |
Sniff Mode Interval (ms) |
Current (uA) |
|---|---|---|
|
IC: 8773EFE VBAT: 3.7V CPU: 40M DVFS: Low Performance Power Mode: DLPS Mode Measuring Time: 30s Transmit Power: 6dbm Sniff Mode Attempt: 2 Sniff Mode Timeout: 5ms |
100 |
364 |
250 |
167 |
|
500 |
100 |
|
1000 |
71 |
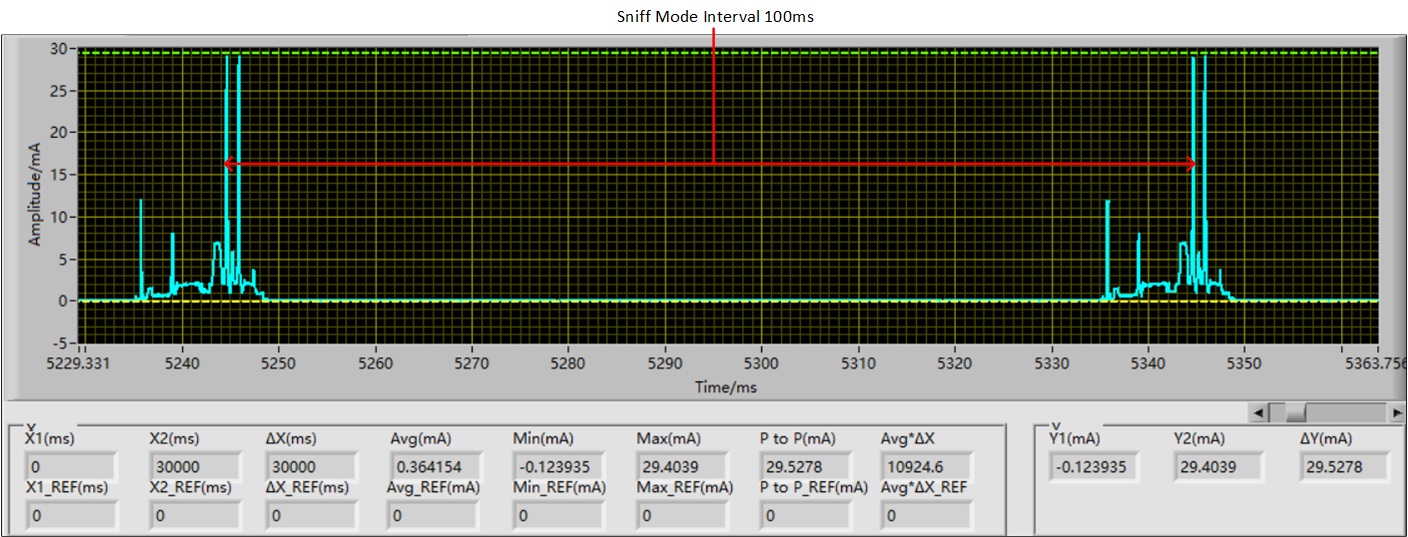
Bluetooth Sniff Mode Interval 100ms
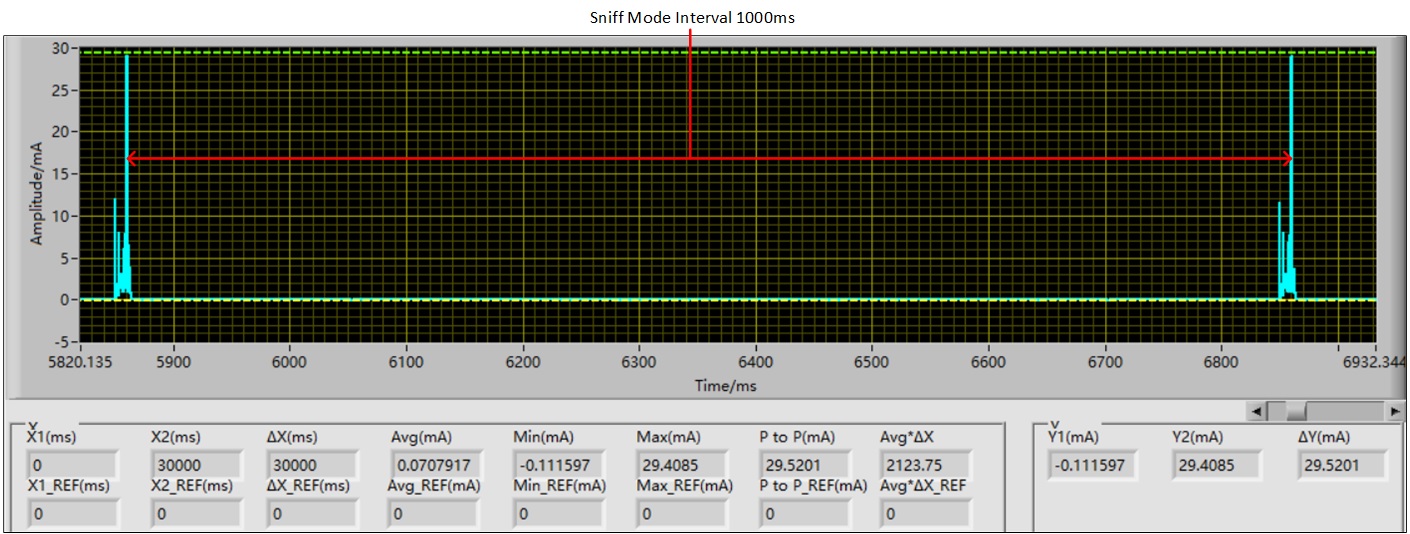
Bluetooth Sniff Mode Interval 1000ms
Different Sniff Mode Attempt
Example:
Test Condition |
Sniff Mode Attempt |
Current (uA) |
|---|---|---|
|
IC: 8773EFE VBAT: 3.7V CPU: 40M DVFS: Low Performance Power Mode: DLPS Mode Measuring Time: 30s Transmit Power: 6dbm Sniff Mode Interval: 500ms Sniff Mode Timeout: 5ms |
2 |
100 |
4 |
129 |
|
6 |
159 |
|
8 |
188 |
The following figure shows the current waveform of sniff mode when setting attempt at 2.
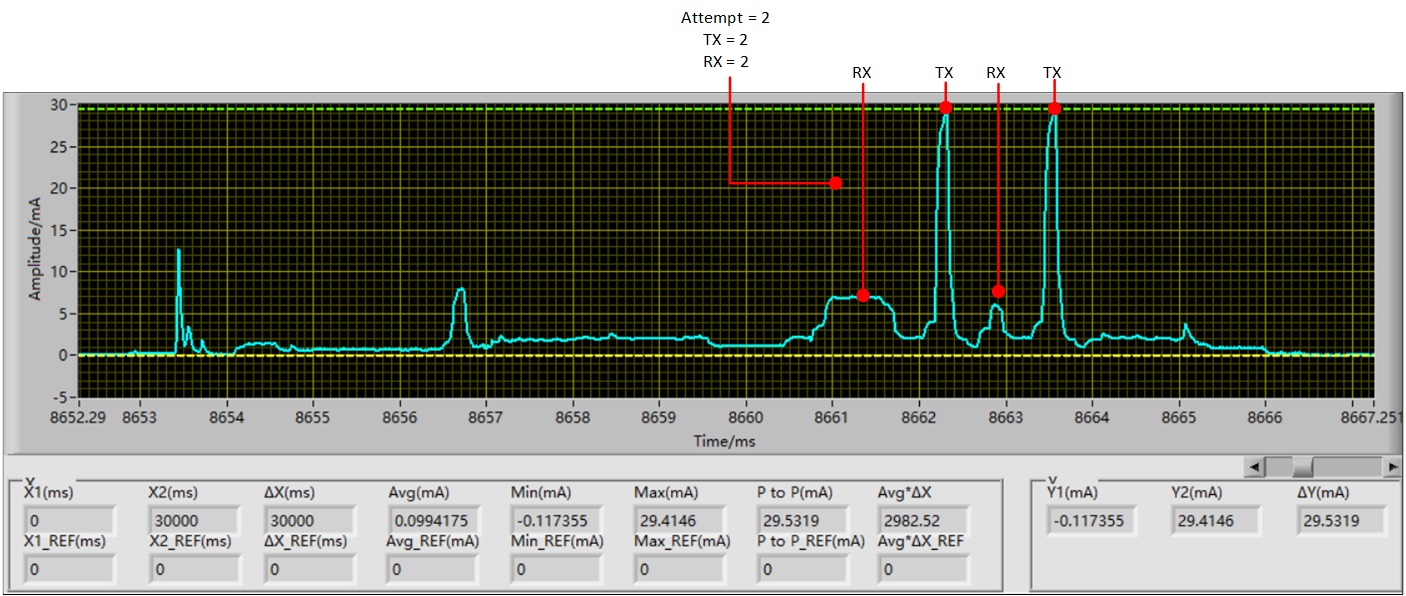
Bluetooth Sniff Mode Attempt 2
The following figure shows the current waveform of sniff mode when setting attempt at 4.

Bluetooth Sniff Mode Attempt 4
Different Sniff Mode Timeout
Example:
Test Condition |
Sniff Mode Timeout (ms) |
Current (uA) |
|---|---|---|
|
IC: 8773EFE VBAT: 3.7V CPU: 40M DVFS: Low Performance Power Mode: DLPS Mode Measuring Time: 30s Transmit Power: 6dbm Sniff Mode Interval: 500ms Sniff Mode Attempt: 2 |
0 |
99 |
5 |
100 |
|
10 |
99 |
|
15 |
129 |
|
25 |
129 |
|
35 |
129 |
|
100 |
129 |
The following figure shows the current waveform of sniff mode when setting timeout at 0ms/5ms/10ms.
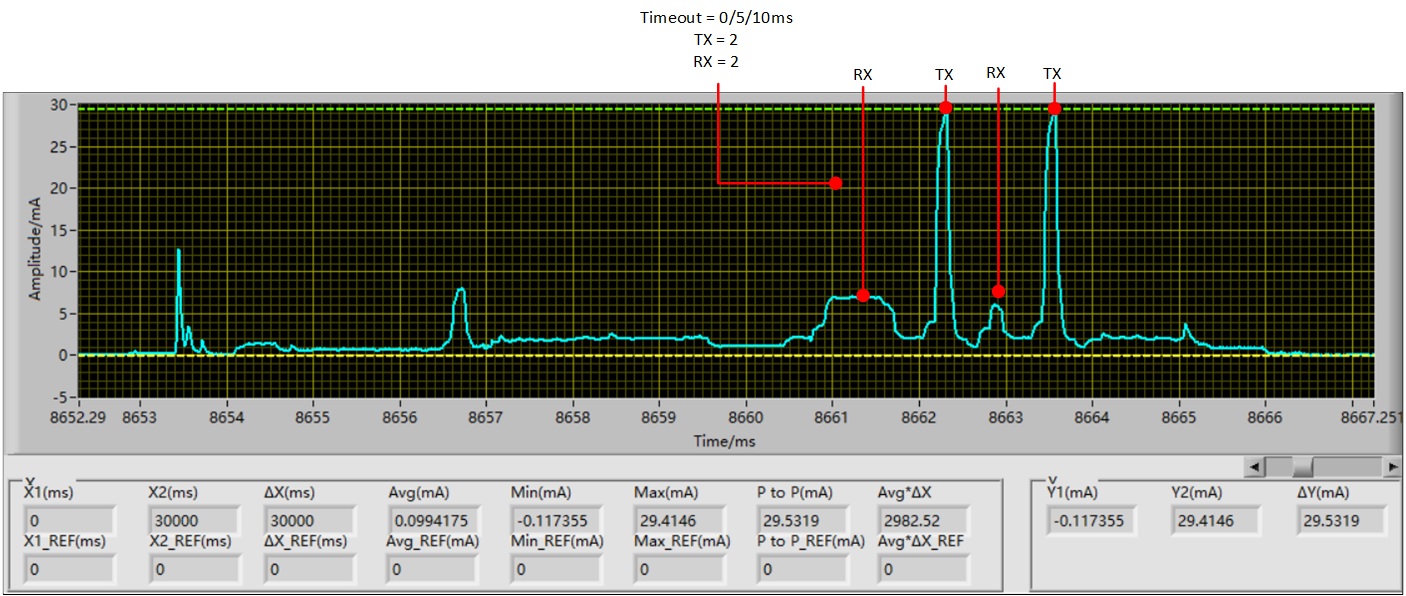
Bluetooth Sniff Mode Timeout 0
The following figure shows the current waveform of sniff mode when setting timeout at 15ms/25ms/35ms/100ms.
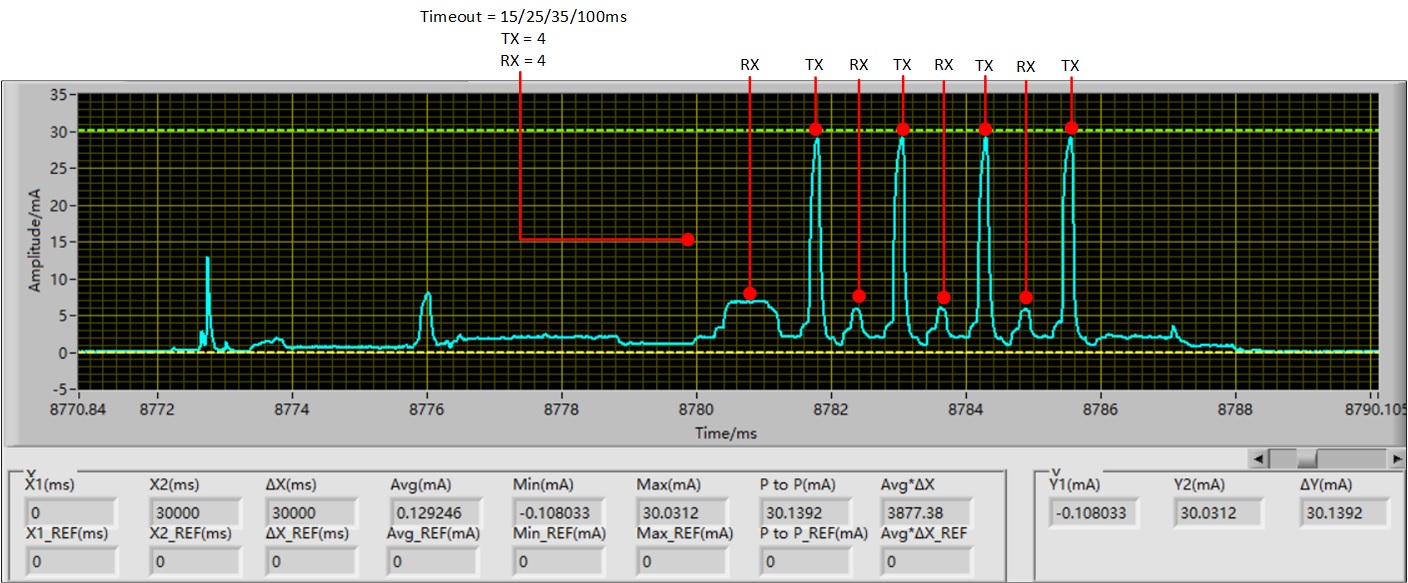
Bluetooth Sniff Mode Timeout 15
From the above results, when timeout is less than 10 (in units of 1.25ms), it has little influence on power consumption. When timeout exceeds 10, the power consumption becomes higher because the SoC forces attempt to be set to 4 and timeout to be set to 2.
Page and Inquiry
Page and inquiry have no parameters affecting power consumption.
RTL87x3E
Test results of RTL87x3E.
Page
Example:
Test Condition |
Type |
Current (mA) |
|---|---|---|
|
IC: 8773EFE VBAT: 3.7V CPU: 40M DVFS: Low Performance Power Mode: Active Mode Measuring Time: 5s Transmit Power: 6dbm |
Page |
7.00 |
Bluetooth Page
Inquiry
Example:
Test Condition |
Type |
Current (mA) |
|---|---|---|
|
IC: 8773EFE VBAT: 3.7V CPU: 40M DVFS: Low Performance Power Mode: Active Mode Measuring Time: 5s Transmit Power: 6dbm |
Inquiry |
7.36 |
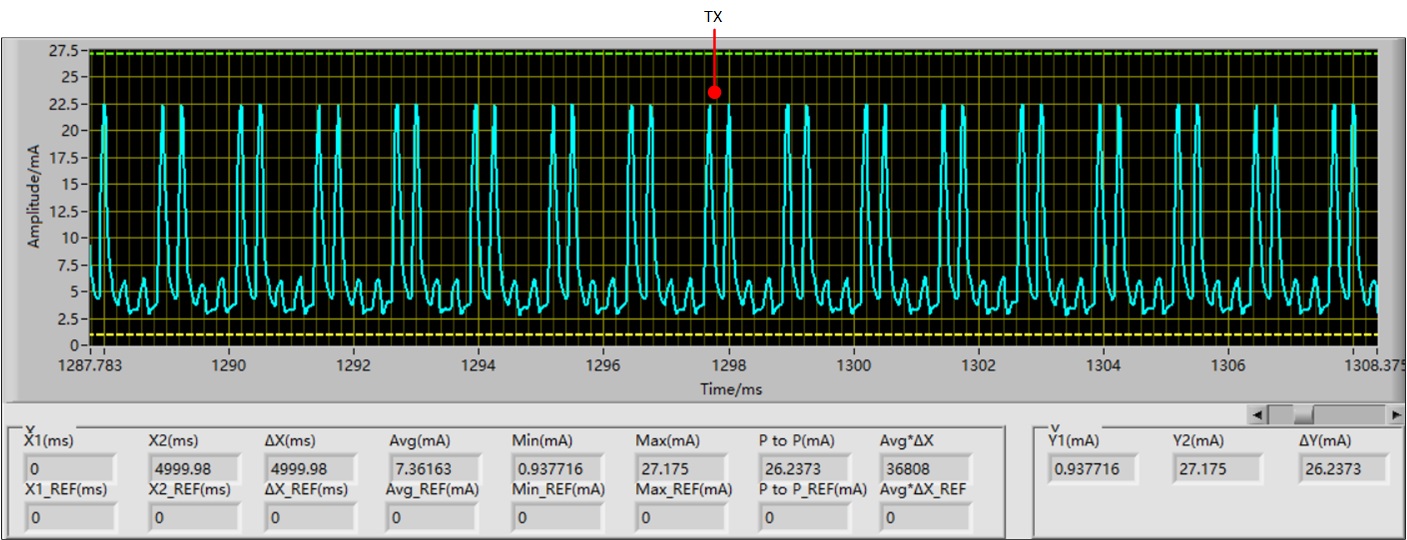
Bluetooth Inquiry