Debug Methods
There are three primary methods for debugging user applications:
Use a logging mechanism to trace the flow of code and monitor values of variables and data. This method helps to identify where the program may be behaving unexpectedly.
Use the console to control program execution and output debugging information. This method provides real-time feedback and allows for dynamic interaction with the running application.
Use Keil MDK and SWD in combination with SWD to control the execution of the program, add and delete breakpoints, and access/trace memory. SWD provides a powerful interface for real-time debugging and monitoring of the application.
You agree that you shall disable all debugging interfaces (such as log UART, console UART, SWD, etc.) before delivering your final products to any third party. Realtek will not be responsible for any information leakage due to not disabling all debugging interfaces.
Log Mechanism
For more details, please refer to Log Mechanism.
SWD
For more details, please refer to SWD.
Debug and Trace
Tracing and debug, on the other hand, provides a historical record of program execution, which is crucial for debugging complex issues that are difficult to reproduce.
CoreSight Introduction
CoreSight is an on-chip debugging and tracing technology designed by ARM. The device manufacturer could implement CoreSight features in various combinations.
Coresight in Coretex-M3
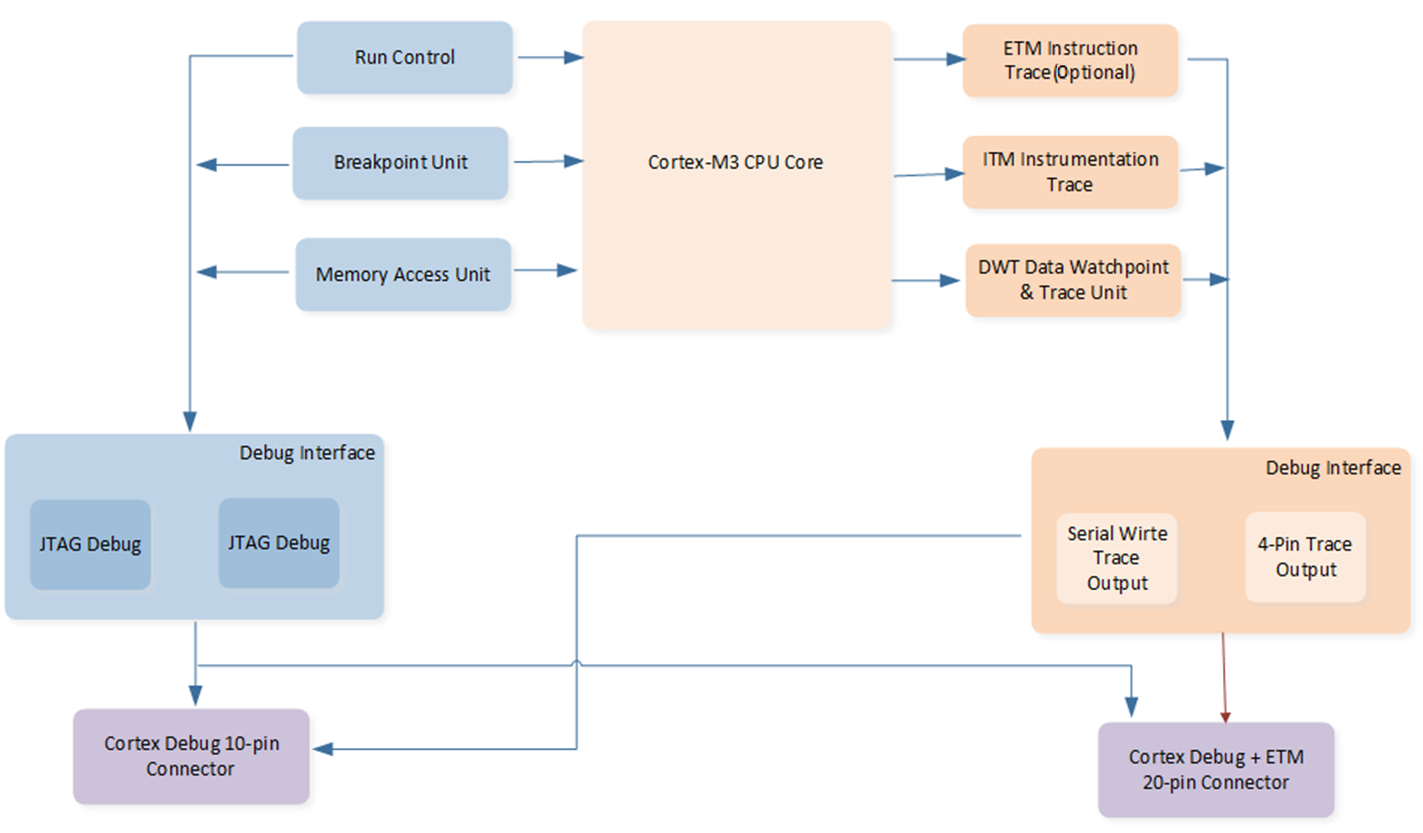
CoreSight features could be accessed through a JTAG or Serial Wire interface. It is impossible to debug in JTAG and Serial Wire mode at the same time. Cortex-M processor-based devices include:
-
The debug interface offers two modes:
JTAG Debug is the industry-standard interface that allows device chaining.
Serial Wire Debug (SWD) is a 2-pin interface with an optional Serial Wire Trace Output. In contrast to JTAG, devices cannot be chained.
-
The debug interface communicates with the following units:
Run Control: Allows starting, stopping, and single-stepping through the source code.
Breakpoint Unit: Allows setting breakpoints even while the processor is running.
Memory Access Unit: Allows reading or writing to memory and peripheral registers even while the program is running.
-
The Trace Port Interface encodes and provides trace information via two possible interfaces:
Serial Wire Trace Output: Used only in Serial Wire Debug mode.
4-Pin Trace Output: Offers a higher bandwidth than Serial Wire Trace Output and uses 5 functional pins. It is the only way to output ETM (Embedded Trace Macrocell) trace data.
-
The Trace Port Interface communicates with the following units:
Embedded Trace Macrocell (ETM): Used for instruction tracing, debugging historical sequences, software profiling, and code coverage analysis. ETM data is output through an additional 4-bit interface.
Instrumentation Trace Macrocell (ITM): Provides application information like debug printf, RTOS information, unit testing, or UML annotation.
Data Watchpoint & Trace Unit (DWT): Offers PC sampling, event counters, timing, and interrupt execution information. Additionally, it allows access breakpoints for up to four memory addresses.
Serial Wire-JTAG Switch (SWJ): JLink/J-Trace generates sequences to automatically switch between Serial Wire Debug and JTAG Debug mode.
Implemented CoreSight Features
The following three basic debug interfaces are supported: Run control, breakpoint, and memory access. Additionally, an advanced feature named access-breakpoint (also known as Debug Monitor), which is one of the features of DWT, is supported.
Using Trace Port Interface DWT
Provides a method to trace memory using DWT. And a group of four APIs is available to monitor up to four memory areas: debug_monitor_point_set().
Here is a sample to show how to use the debug monitor APIs.
debug_monitor_enable();
debug_monitor_point_set(WATCH_POINT_INDEX0, 0x200000, WATCH_POINT_BYTE, WATCH_POINT_FUNCTION_DADDR_W);
debug_monitor_point_set(WATCH_POINT_INDEX1, 0x200008, WATCH_POINT_BYTE, WATCH_POINT_FUNCTION_DADDR_W);
If the monitored memory is accessed, the debug monitor interrupt would be triggered. The PC register which is the broken position, will be printed to the log UART and it could be traced using Debug Analyzer.
TraceAlyzer
Tracealyzer, developed by Percepio AB, is a powerful real-time tracing and analysis tool widely used in embedded system development and debugging. It helps developers gain deep insights into system behavior, perform performance optimization, and troubleshoot issues.
TraceAlyzer Introduction
RTL87x3D supports profiling with TraceAlyzer. TraceAlyzer download link: https://percepio.com/downloadform/.
TraceAlyzer communicates with RTL87x3D through JLink. Before using TraceAlyzer, please ensure that JLink is connected correctly and this function is turned on in the MCUConfig Tool.
Most of the trace information can be added automatically. However, ISR trace information needs to be added manually.
Add ISR Trace Info
Using the following functions to add ISR trace info. os_trace_isr_create() function is used by APP to create a handler to trace ISR info, including the user's name and priority. os_trace_isr_begin() function is used to identify the ISR started. os_trace_isr_end() function is used to identify the ISR ended.
A brief demo:
#include "os_trace.h"

void *p_Handle;

void testIsrInit(void)
{
    os_trace_isr_create(&p_Handle, "test isr", 4);
}

void testIsrHandler(void)
{
    // notify tracklayer that the current isr start running
    os_trace_isr_begin(p_Handle);

    .....

    // notify traceAlyzer that the current isr finished running
    os_trace_isr_end();
}
After adding all ISR trace info, the user can open TraceAlyzer to profile RTL87x3D.
TraceAlyzer Setting
.
Target Connection setting: SEGGER RTT.
RTT Control Block Address: Search
_SEGGER_RTTinROM.lib, and fill in its address.
For example:
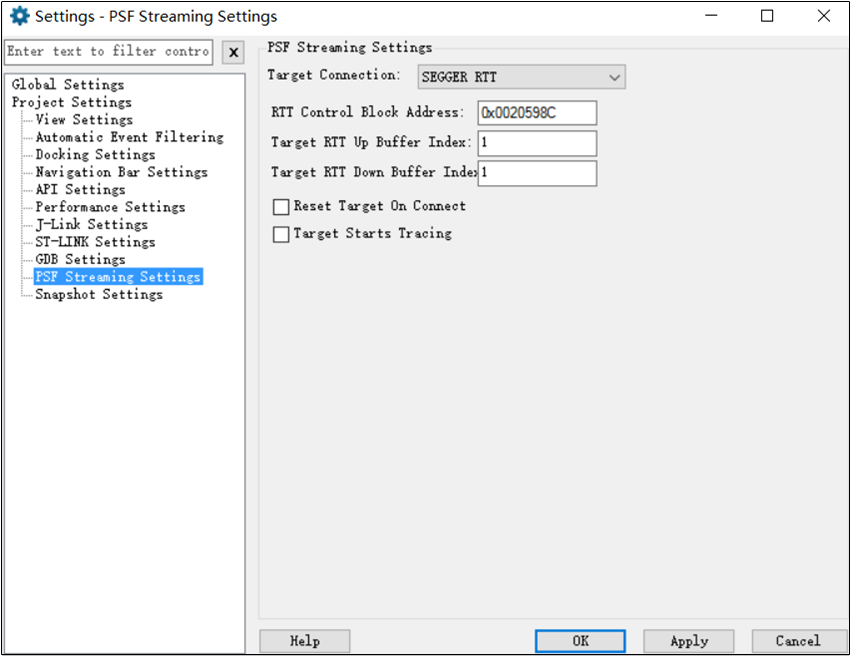
TranceAlyzer Setting
After setting TraceAlyzer, Start Session. TraceAlyzer will display profiling info. More info could be found in TraceAlyzer's window.
Disable Debugging System
A method to disable logging is provided, allowing easy shutdown of log generation when no longer needed. This feature helps improve system performance by reducing unnecessary data storage and can be conveniently re-enabled when debugging or monitoring is required.
Disable Log
Users can disable log in MCUConfig Tool, as shown below.
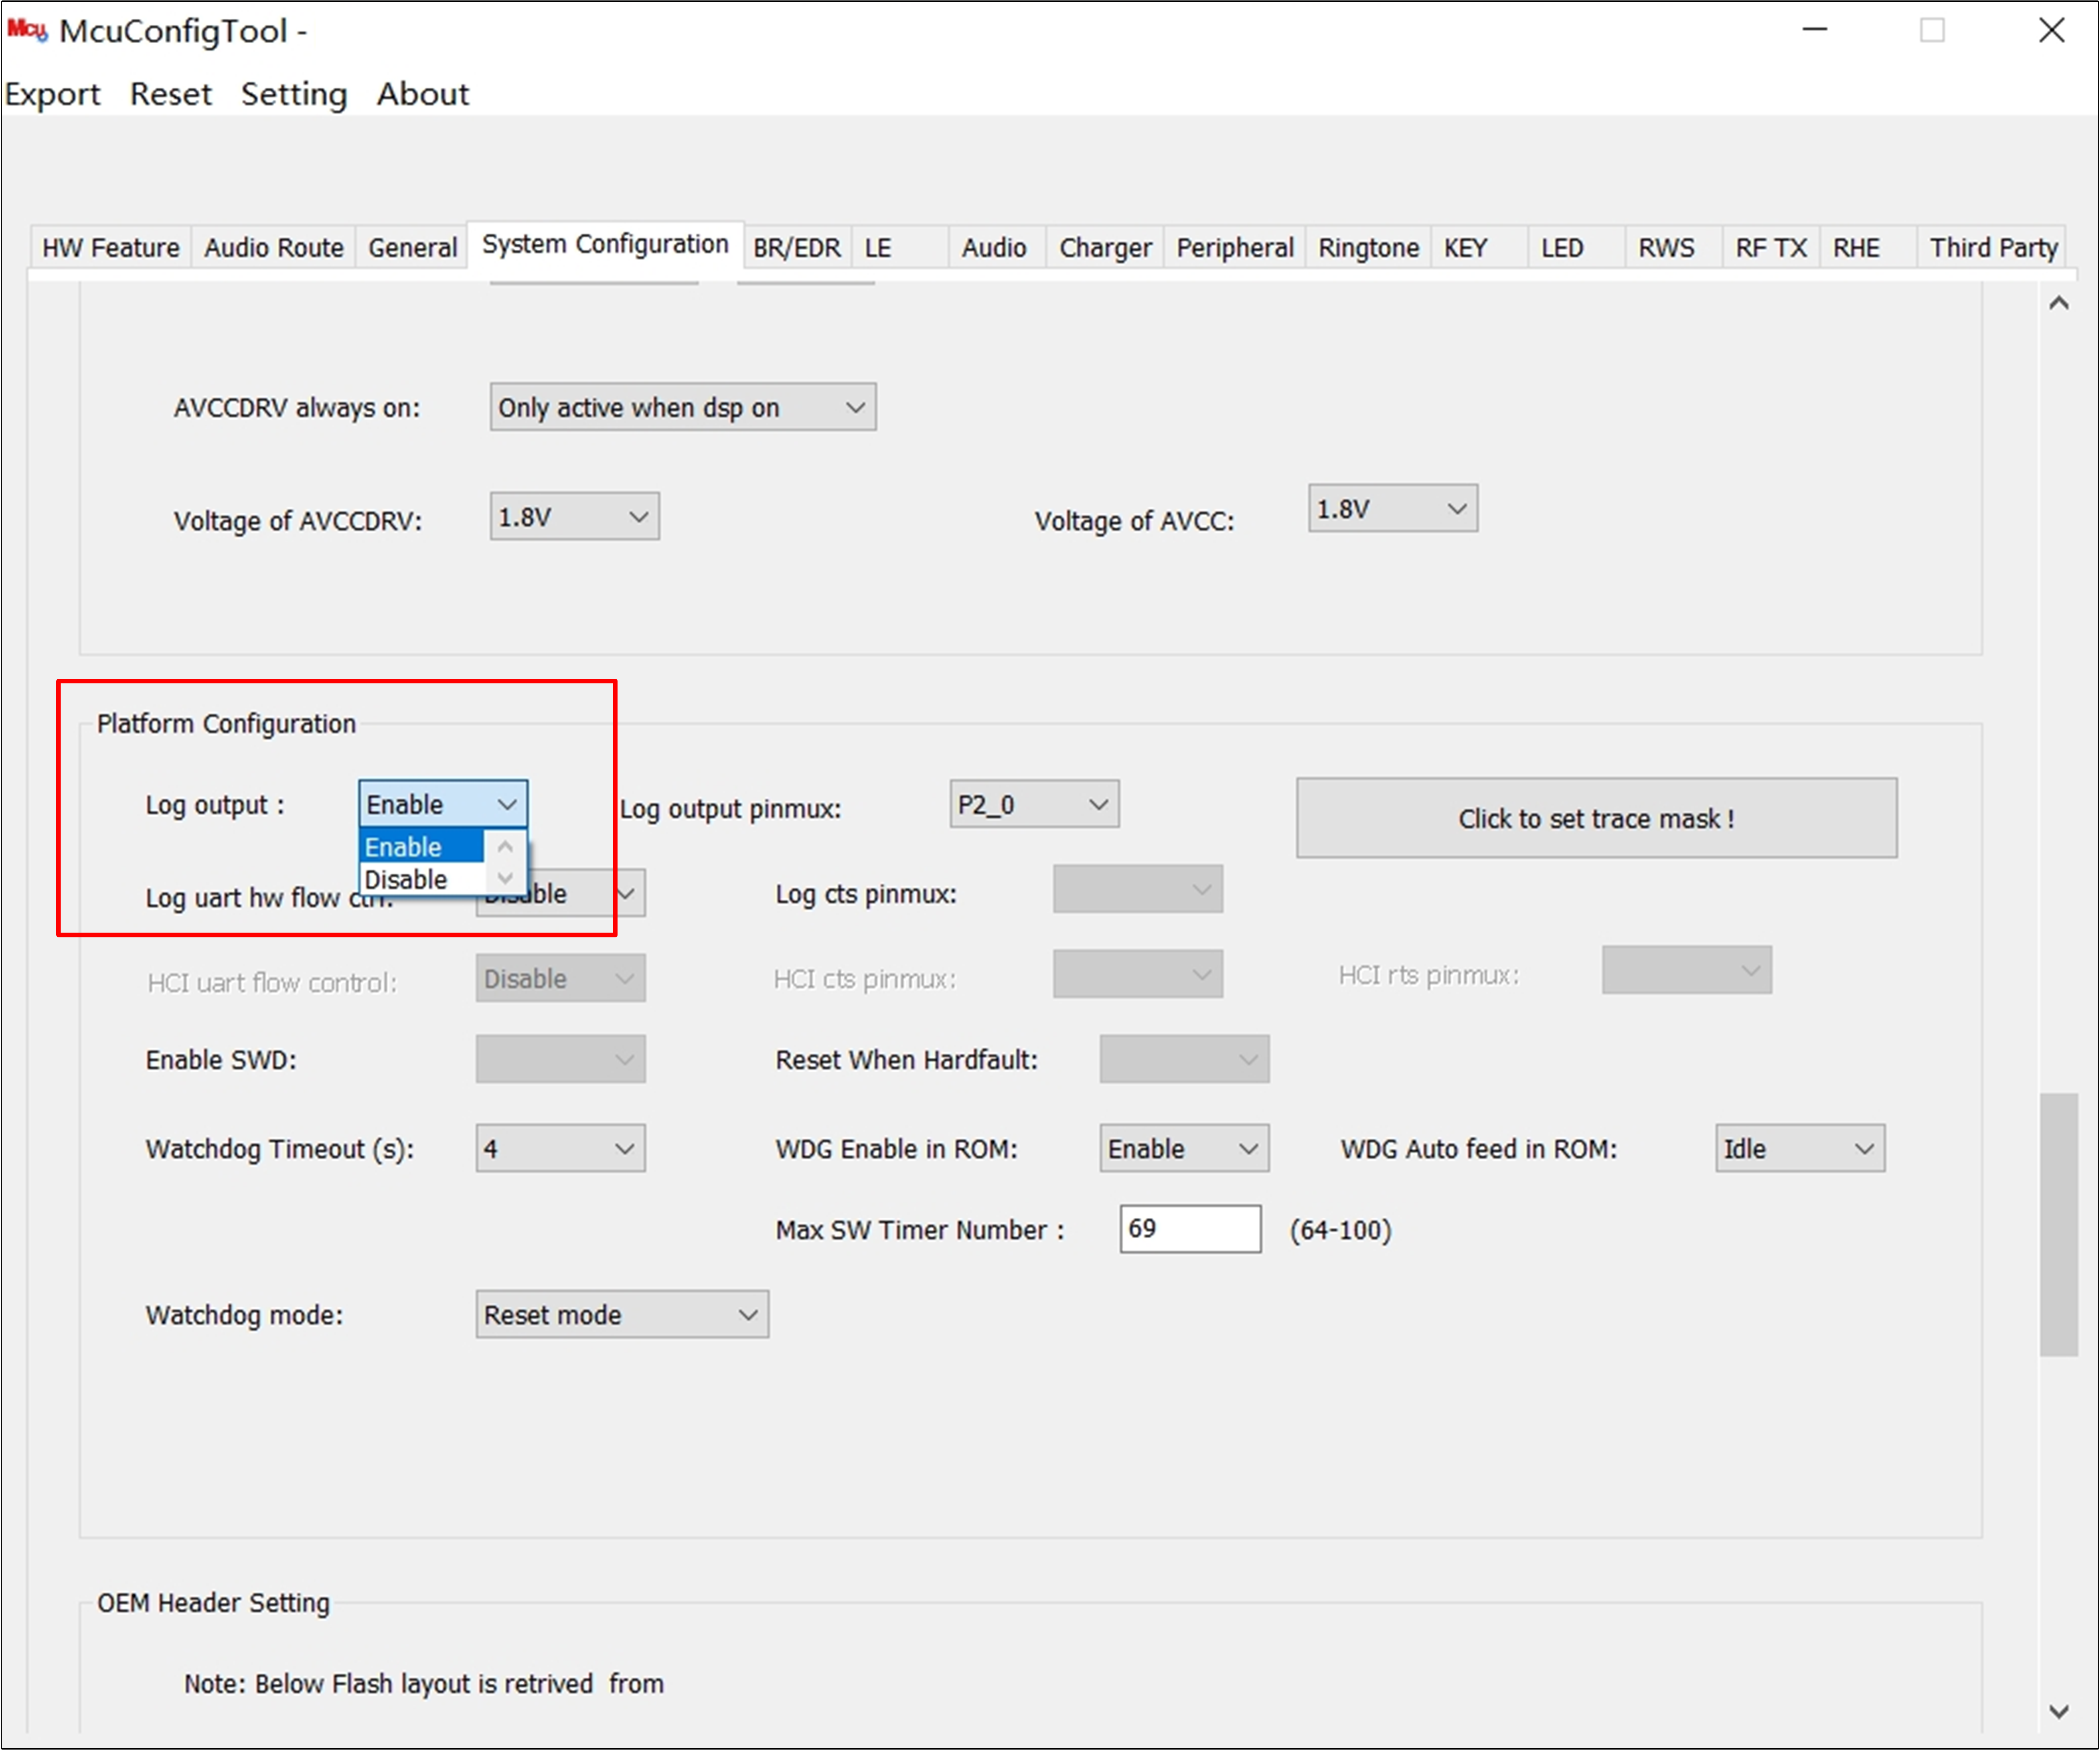
Disable Log
Disable Console
User can disable console by disabling macro F_APP_CONSOLE_SUPPORT in app_flag.h.
Disable SWD
SDK uses p1_0 and p1_1 as SWDIO and SWCLK. User can use p1_0 and p1_1 for other purposes to disable SWD.
Use the appropriate debugging methods during development to help identify and resolve issues effectively. However, always disable all debugging interfaces before delivering the final products to any third parties to prevent unauthorized access and potential information leakage.
See Also
Please refer to the relevant API Reference: