Debug Analyzer
The Debug Analyzer is an advanced diagnostic tool designed to simplify the debugging process for users. It aims to streamline the identification and resolution of software issues, facilitating a more efficient development cycle.
Log Mechanism
There is a configurable log UART pin (P2_0 by default) to print logs, and several APIs are provided to control logging easily:
Log output is disabled by default. Users should enable it in the MCUConfig Tool and download the configuration file via the MPPG Tool.
Log data is output in a specific format, and a corresponding .trace file is generated in the bin folder of the current APP project. The Debug Analyzer Tool can load this trace file, retrieve, analyze, display, and save logs.
If the log pin is changed via the MCUConfig Tool, the new log pin will be valid in the sys patch image for the RTL87x3E or the ROM patch image for the RTL87x3D. Some boot logs will still be output through the default log pin P2_0.
Debug Level
There is a concept named Debug Level, and it indicates which level the log is displayed. Four levels are defined:
Debug Level |
Usage Scenario |
|---|---|
LEVEL_ERROR |
Fatal, the procedure could not advance (Log Token !!!) |
LEVE_WARN |
Abnormal condition occurred, but procedure could advance (Log Token !!*) |
LEVEL_INFO |
Important notification (Log Token !**) |
LEVEL_TRACE |
Verbose debug |
The DBG_BUFFER() is flexible and powerful but may be difficult to use.
SDK has wrapped it and provided some readable APIs in trace.h.
Wrapped Interfaces for Log Printing
There are several wrapped APIs for the user to print logs, and all of them have a common syntax:
{MODULE} could be replaced with the module name defined in
trace.h, such as APP/GAP/USB/FLASH…{LEVEL} could be replaced with the debug level: ERROR/WARN/INFO/TRACE.
{PARAMNUM} could be replaced with numbers 0 to 8, which means the number of parameters this log would print out.
For example, if the user wants to print a warning log with 2 parameters in the application, the code should be written like this:
APP_PRINT_WARN2("Test app: ID = %d, data = 0x%x", id, data);
Then Debug Analyzer Tool would show this log like:
00494 10-13 17:06:45.994 087 02145.435 [APP] !!*Test app: ID = 3, data = 0xF0
Note
Do not exceed 8 parameters (Maximum 20 parameters if using
DBG_BUFFER()directly).Put all parameters into a single print if possible.
Auxiliary Interfaces
The DBG_BUFFER() API can only print simple formats like Integer (%d, %i, %u, %o, %x), Character (%c), and Pointer (%p).
Sometimes the user wants to print a string, binary array, or bluetooth Address, thus three auxiliary interfaces have been provided:
TRACE_STRING(data): Directly put the string into log data, and the conversion directive is %s.TRACE_BINARY(length, data): Output binary stream in Hex format, and the conversion directive is %b.TRACE_BDADDR(bd_addr): Output binary array in bluetooth address format, for example: Hex Array: 0xaa 0xbb 0xcc 0xdd 0xee 0xff –> Literal String: FF::EE::DD::CC::BB::AA.
Log Print Example
A sample of the common use of log APIs and the corresponding output in Debug Analyzer is shown below. Log print code:
uint32_t n = 77777;
uint8_t m = 0x5A;
uint8_t bd1[6] = {0x00, 0x11, 0x22, 0x33, 0x44, 0x55};
uint8_t bd2[6] = {0xAA, 0xBB, 0xCC, 0xDD, 0xEE, 0xFF};
char c1[10] = {'1', '2', '3', '4', '5', '6', '7', '8', '9', '0'};
char c2[8] = {'a', 'b', 'C', 'd', 'E', 'F', 'g', 'H'};
char *s1 = "Hello world!";
char *s2 = "Log Test";
ADC_PRINT_TRACE1("ADC value is %d", n);
UART_PRINT_INFO3("Serial data: 0x%x, c1[%b], s1[%s]", m, TRACE_BINARY(10, c1), TRACE_STRING(s1));
GAP_PRINT_WARN6("n[%d], m[%c] bd1[%s], bd2[%s], c2[%b], s2[%s]", n, m, TRACE_BDADDR(bd1),
                TRACE_BDADDR(bd2), TRACE_BINARY(8, c2), TRACE_STRING(s2));
APP_PRINT_ERROR0("APP ERROR OCCURED...");
The corresponding result is shown in Debug Analyzer:
00252 10-25 17:12:02.021 132 10241 [ADC] ADC value is 77777
00253 10-25 17:12:02.021 133 10241 [UART] !**Serial data: 0x5a, c1[31-32-33-34-35-36-37-38-39-30], s1[Hello world!]
00254 10-25 17:12:02.022 134 10241 [GAP] !!*n[77777], m[Z] bd1[55::44::33::22::11::00], bd2[FF::EE::DD::CC::BB::AA], c2[61-62-43-64-45-46-67-48], s2[Log Test]
00255 10-25 17:12:02.022 135 10241 [APP] !!!APP ERROR OCCURRED...
Log Control Interfaces
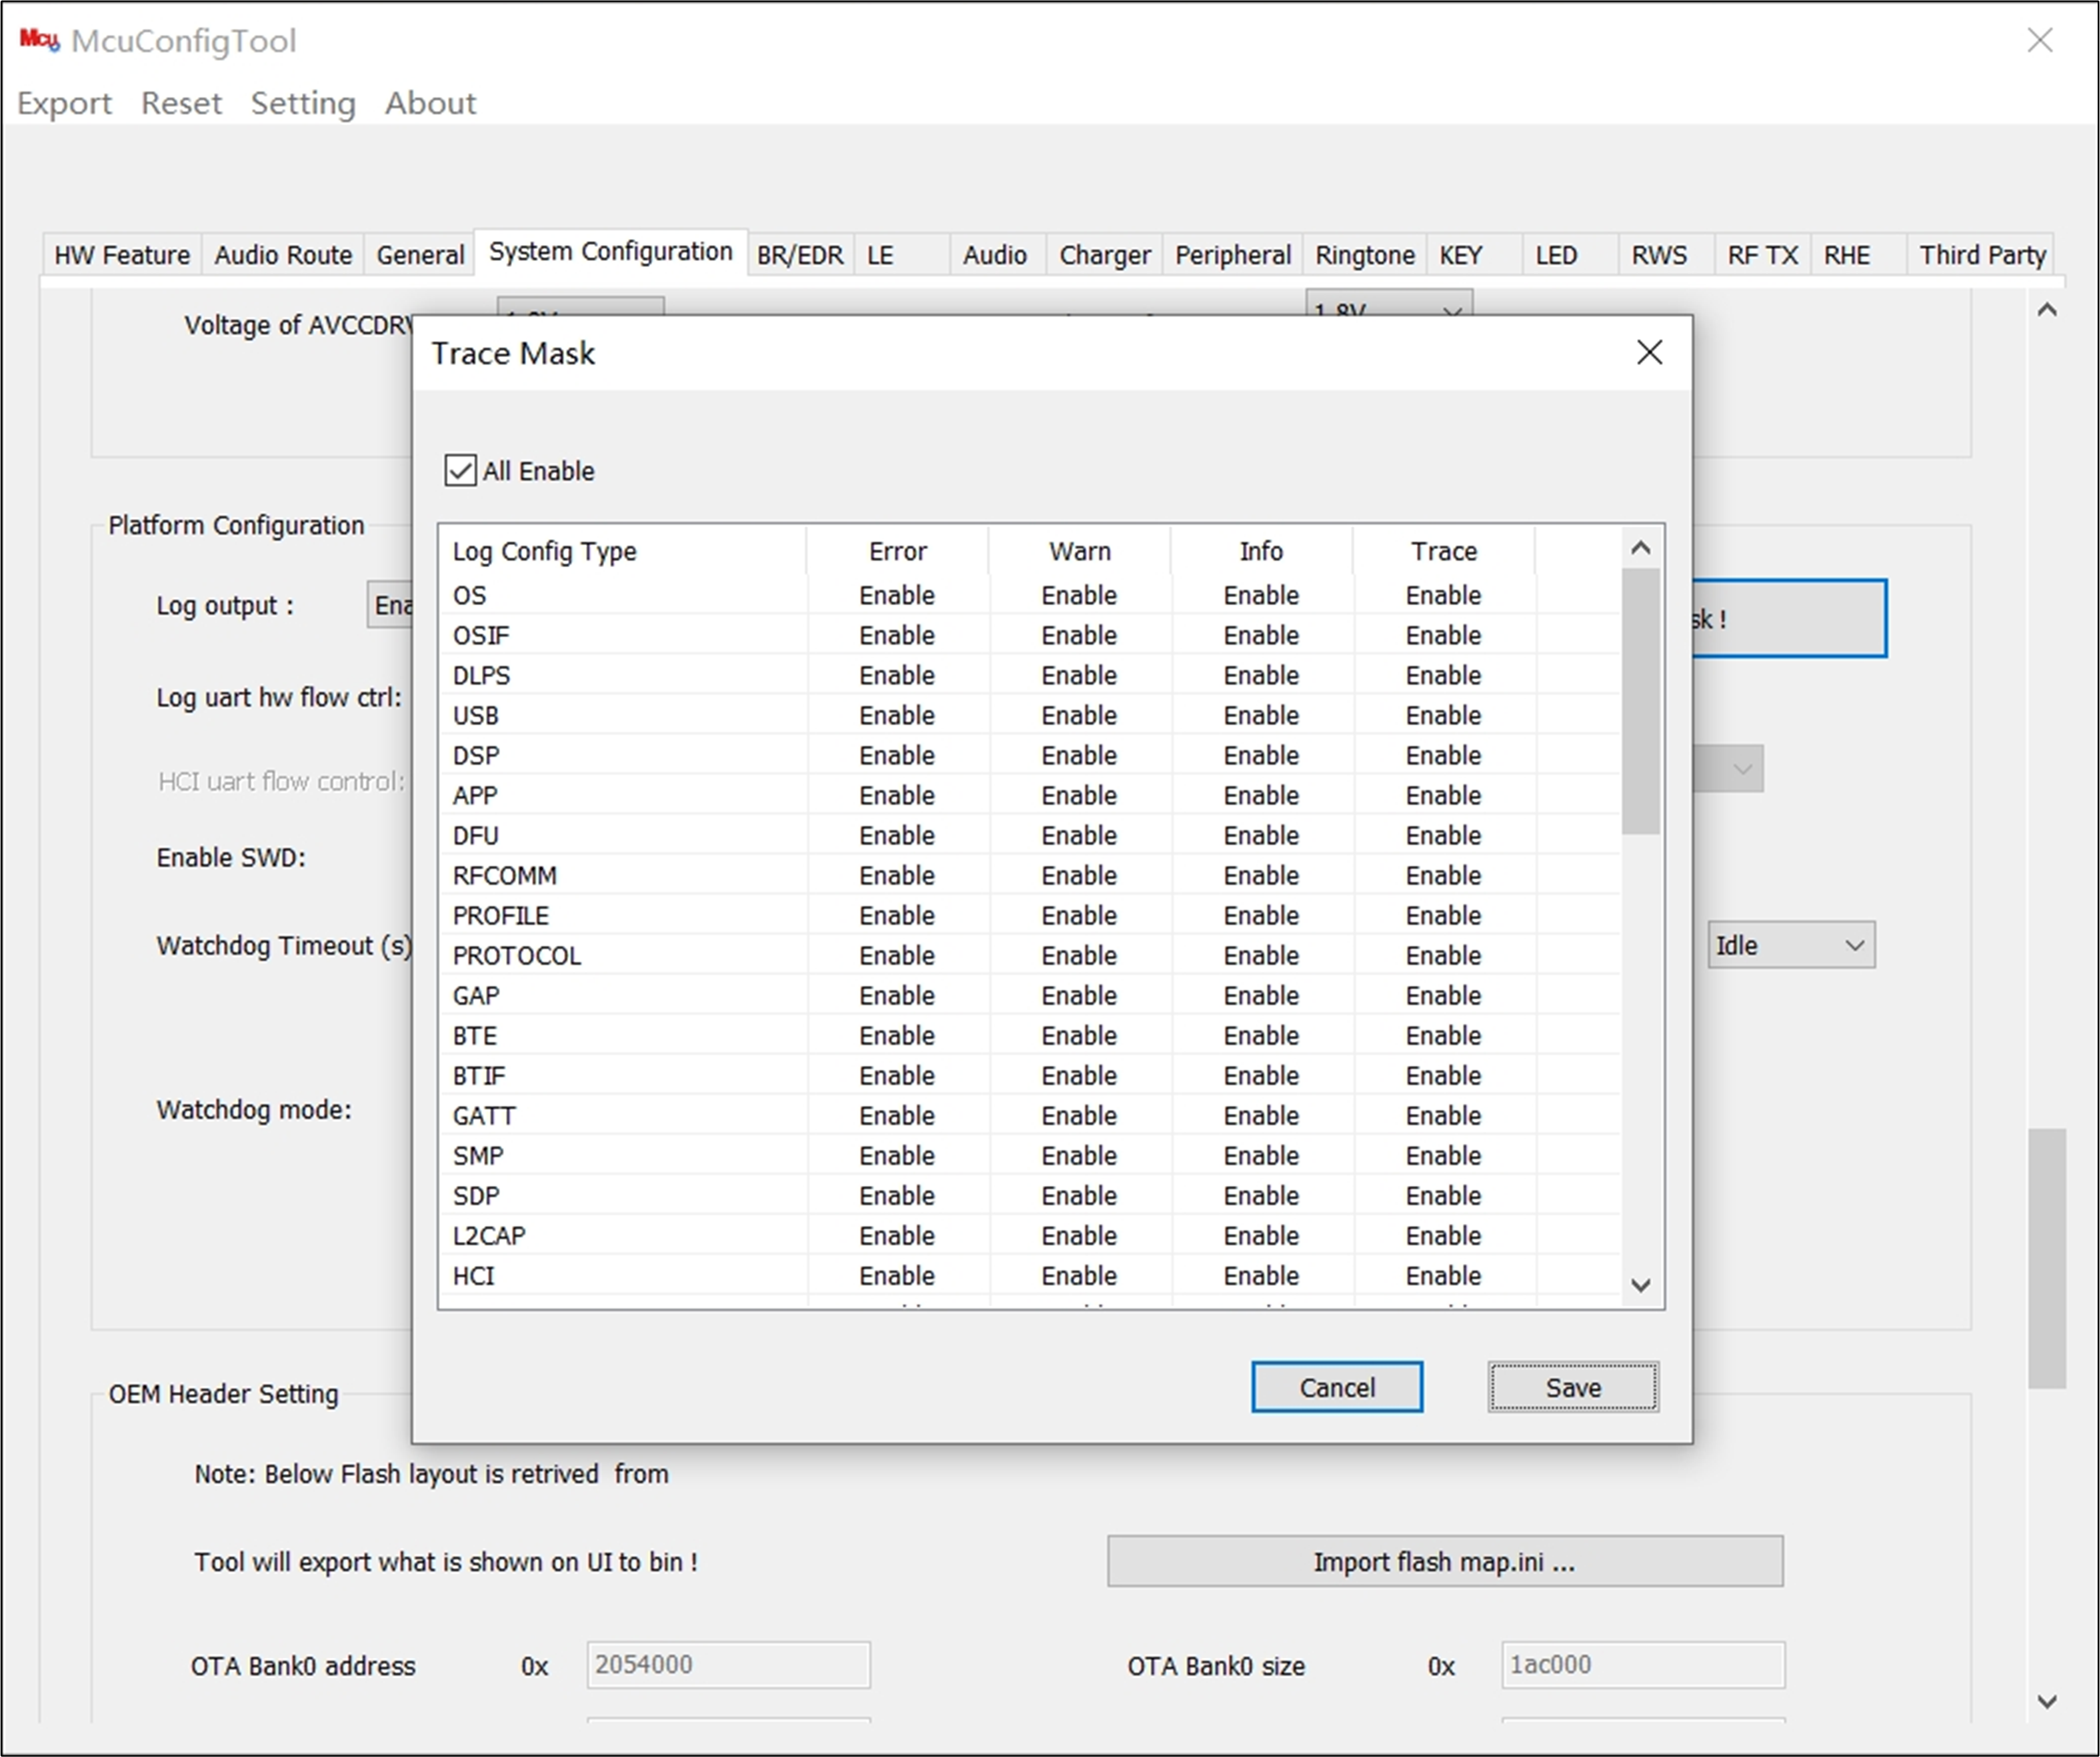
Sometimes user wants to turn on some logs and turn off others. One method is to set the trace mask in MCUConfig Tool, and then burn the config file.
However this is not flexible enough as the user may want to change the log level frequently, and it is unwise to re-burn the config file every time. Three APIs have been provided to control the log at a specific level of a specific module:
log_module_trace_init()log_module_trace_set()log_module_bitmap_trace_set()
Refer to the SDK API document for details of parameters.
Log Control Sample Scenarios
Here are some sample scenarios to help understand how to use log control APIs in user applications. Assuming that log print is already enabled and all log trace masks have been set to Enable in MCUConfig Tool, this means all types of logs at all levels could be output.
Senario 1: Disable all trace and info level logs for the APP module.
int main(void)
{
    log_module_trace_set(MODULE_APP, LEVEL_INFO, false);
    log_module_trace_set(MODULE_APP, LEVEL_TRACE, false);
    ...
}
Senario 2: Enable only PROFILE module logs.
int main(void)
{
    uint64_t mask[LEVEL_NUM];
    memset(mask, 0, sizeof(mask));
    log_module_trace_init(mask);

    log_module_trace_set(MODULE_PROFILE, LEVEL_ERROR, true);
    log_module_trace_set(MODULE_PROFILE, LEVEL_WARN, true);
    log_module_trace_set(MODULE_PROFILE, LEVEL_INFO, true);
    log_module_trace_set(MODULE_PROFILE, LEVEL_TRACE, true);
    ...
}
Senario 3: Disable trace level logs for PROFILE/PROTOCOL/GAP/APP modules.
int main(void)
{
    log_module_bitmap_trace_set(MODULE_BIT_PROFILE | MODULE_BIT_PROTOCOL | MODULE_BIT_GAP |
                            MODULE_BIT_APP, LEVEL_TRACE, false);
    ...
}
Senario 4: Disable all trace and info level logs except APP module, and disable bluetooth Snoop logs.
int main(void)
{
    for (uint8_t i = 0; i < MODULE_NUM; i++)
    {
        log_module_trace_set((T_MODULE_ID)i, LEVEL_TRACE, false);
        log_module_trace_set((T_MODULE_ID)i, LEVEL_INFO, false);
    }
    log_module_trace_set(MODULE_APP, LEVEL_INFO, true);
    log_module_trace_set(MODULE_APP, LEVEL_TRACE, true);
    log_module_trace_set(MODULE_SNOOP, LEVEL_ERROR, false);
    ...
}
Note
Debug Analyzer could generate a bluetooth Snoop log file (*.cfa) if the LEVEL_ERROR log of MODULE_SNOOP is enabled. In other words, if users turn off the log of MODULE_SNOOP, the bluetooth Snoop log file would not be generated, such as Scenario 2 and Scenario 4.
Direct Log Printing
DBG_DIRECT() API prints log directly, which supports integer and string parameters. Its function is the same as the C standard library function printf. Print format and the number of parameters are not limited.
Note that this method may cause system performance degradation and incorrect UART data. Therefore, we recommend using it only for debugging.
Log print code:
uint32_t n = 77777;
char *s1 = "Hello world!";
DBG_DIRECT("DBG_DIRECT test %d %s", n, s1);
The corresponding result is shown in Debug Analyzer:
0000047 04-17 12:28:16.181 070 0000359.757 DBG_DIRECT test 77777 Hello world!
The Debug Analyzer, combined with a versatile logging mechanism, provides a robust framework for diagnosing and resolving software issues efficiently. Utilize the logging APIs, control interfaces, and the Debug Analyzer to streamline your debugging process and enhance your development cycle.