Exception Handler
By mastering this systematic workflow - combining register analysis with stack reconstruction - developers can pinpoint the exact origin of complex faults, transforming opaque system crashes into actionable debugging insights.
HardFault Analysis Guide
Diagnosing a HardFault requires piecing together the system's state at the moment of failure. This guide outlines a structured approach to finding the root cause: interpreting Status Registers to identify the error type, checking Address Registers to locate the specific instruction or data fault, and analyzing the Stack to reconstruct the execution history.
Fault Status Registers (Diagnose Why It Failed)
The Fault Status Registers record the specific events that triggered the exception, serving as the key to diagnosing the root cause. By examining flags in the HFSR and CFSR, you can distinguish between error types - such as memory violations, bus errors, or undefined instructions - to understand exactly why the system failed.
Key Registers Description
HFSR (HardFault Status Register): Acts as the top-level indicator. It explains why a fault escalated into a HardFault (e.g., a 'Forced' HardFault due to a disabled handler for a lower-level fault).
-
CFSR (Configurable Fault Status Register): The primary register for diagnosing the specific cause. It is a combined 32-bit register split into three sub-registers:
UFSR (Usage Fault Status): Records execution-related faults such as undefined instructions, invalid state transitions, or divide-by-zero errors.
BFSR (Bus Fault Status): Records bus interface errors (instruction prefetch, data access). Crucially, it distinguishes between Precise errors (known fault address) and Imprecise errors (write buffering delays).
MMFSR (MemManage Fault Status): Records violations related to the Memory Protection Unit (MPU), such as writing to read-only regions or executing from non-executable memory.
Fault Address Registers (Diagnose Where It Failed)
MMFAR (MemManage Fault Address Register): Holds the address that caused a MemManage fault. Valid only when the corresponding VALID bit is 1.
BFAR (Bus Fault Address Register): Holds the address that caused a Bus fault. Valid only when the corresponding VALID bit is 1.
To pinpoint the exact cause of a crash - such as distinguishing between a stack overflow and a null pointer dereference - you must decode the individual bits in these registers. For a complete and consolidated reference of every bit definition across the HFSR, CFSR, MMFAR, and BFAR, refer to the official ARM application note ARM Keil AN209: Using Cortex-M3/M4/M7 Fault Exceptions.
Core Registers and Scene Reconstruction (Diagnose Execution State)
When a fault occurs, the CPU automatically pushes several core registers onto the stack. By examining these registers, you can reconstruct the execution state at the time of the fault.
Register |
Full Name |
Role in Debugging |
|---|---|---|
Program Counter |
Crash site. Points to the next instruction to execute; it is used to locate the faulting code. |
|
LR |
Link Register |
Return address. Helps identify the caller; it is used to build the call chain. |
SP |
Stack Pointer |
Current top of stack. Check for overflow/out-of-range; it is also used to find stacked PC/LR on exception entry. |
Note
If PC is a reasonable Flash address (e.g.,
0x080...) or a RAM address (e.g.,0x20...), the PC value is likely valid.If PC is a strange value (e.g.,
0x00000000or0xFFFFFFFF), the function pointer may be null, or the stack is corrupted. The PC was restored to a wrong value. This means the program went out of control.
CoreDump Parser Debug Workflow
The DebugAnalyzer tool supports parsing Core Dump data to locate hard faults.
-
Open the Tool
Launch DebugAnalyzer, and select from the menu bar to open the configuration page.
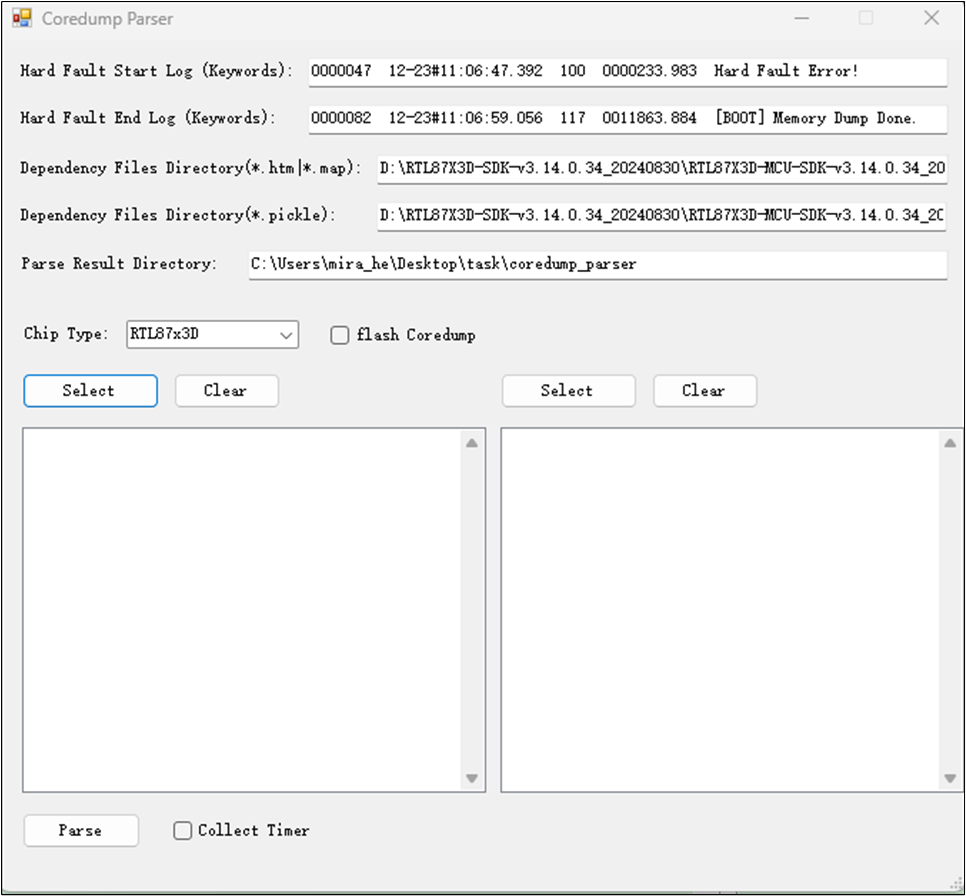
Core Dump Parser Setting
-
Configuration Settings
Configure the parser settings based on your scenario. Refer to the table below for details:
Core Dump Parsing Tool Configuration Options Option
Description
Hard Fault Start Log
The keyword indicating the start of the exception log in the
.logfile (e.g., Hard Fault Error or Watchdog Interrupt). See Keywords Table below.Hard Fault End Log
The keyword indicating the end of the exception log in the
.logfile (e.g., Mem Dump Done).Dependency Files (
*.htm,*.map)Path to the directory containing dependency files (
.htm,.map). Ensure these match the running firmware image.Dependency Files (
*.pickle)Path to the directory containing
.picklefiles.Parse Result Directory
Path where the parsed results will be saved.
Chip Type
Select the target IC type (e.g., RTL87x3E or RTL87x3D). Note: Core Dump Parsing is only supported for these types.
Flash Core Dump
Check this box if parsing a core dump file read back from flash. If checked, you do not need to fill in Keywords or select a
*.logfile.Select
*.bin/*.logFilesSelect the raw binary dump (
.bin) and the corresponding log file (.log). -
Keywords Reference
Use the following keywords for the Start/End Log fields based on the fault type:
Log Parsing Keywords Reference Type
Start Log (Keywords)
End Log (Keywords)
Hard Fault
Hard Fault Error
RTL87x3E:Mem Dump Done or RTL87x3D:Memory Dump Done
WDT (Watchdog Timer)
RTL87x3E:Watchdog Interrupt or RTL87x3D:WDT Interrupt
RTL87x3E:Mem Dump Done or RTL87x3D:Memory Dump Done
-
Execute Parsing
Click the Parse button. The button will be grayed out during processing. Wait for the result window to appear.
Core Dump Parser Result
Note
Pre-requisite: To use the Core Dump Parser effectively, make sure that the ROM trace file item in the Trace File Path Settings was correctly configured before recording the logs via DebugAnalyzer.
Flash Core Dump Mode: If you use the Flash Coredump option, you only need to select the
.binfile containing the dump.
Practical Analysis Workflow
-
Identify the fault type.
Read HFSR and CFSR.
Decide if it is an MPU fault, a Bus fault, or another type.
-
Find the fault address.
Check MMFAR or BFAR.
Use the Valid bit to confirm the address is valid.
-
Restore the code location.
Find the PC value in the stack.
Search the PC in the build
.mapor.disasmfile.Locate the source line and the function name.
-
Trace the callers (build the call chain).
Find the LR value in the log bin file.
Search this address in the
.mapfile to see who called the faulting function.Move down to the previous caller's LR.
Repeat until the call chain is clear.
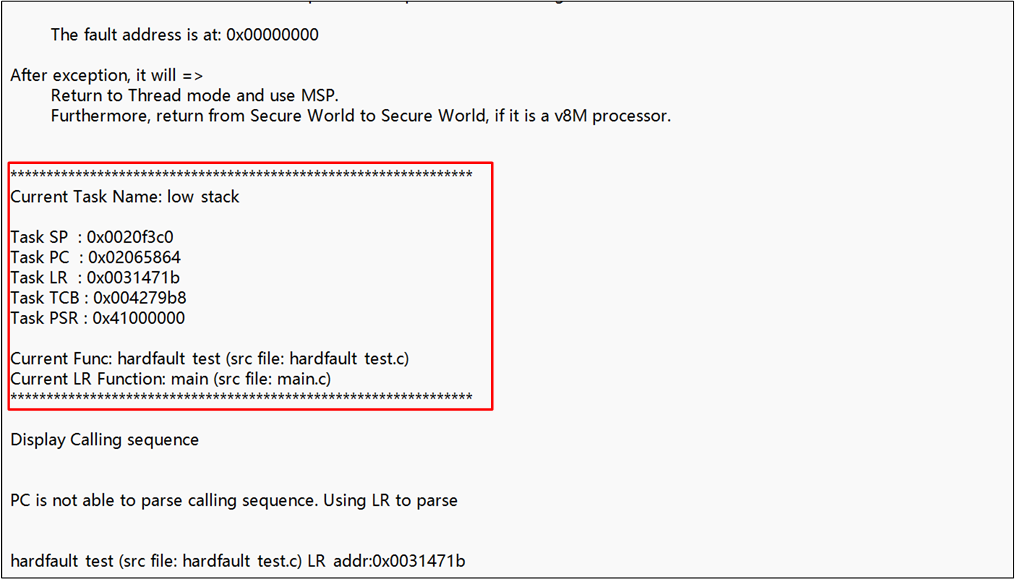
Simple Case Analysis
Simple Case Diagram
HFSR : Bit 30 = 1
CFSR :
0x00000082MMFAR :
0x00000000
Debug Flow:
-
HFSR Check
Bit 30 (FORCED) = 1.
Conclusion: This is a forced HardFault. The root cause is in CFSR.
-
CFSR Check (
0x82)Bit 7 (MMARVALID) = 1 → The address in MMFAR is valid.
Bit 1 (DACCVIOL) = 1 → Data access violation. The MPU blocked the access.
-
Address Check
MMFAR =
0x00000000.Conclusion: The program tried to read or write address
0x00000000.
-
Locate the Code
Search the PC value in the build
.mapor.disasmfile.Find the exact source line and the faulting function name:
hardfault_test.
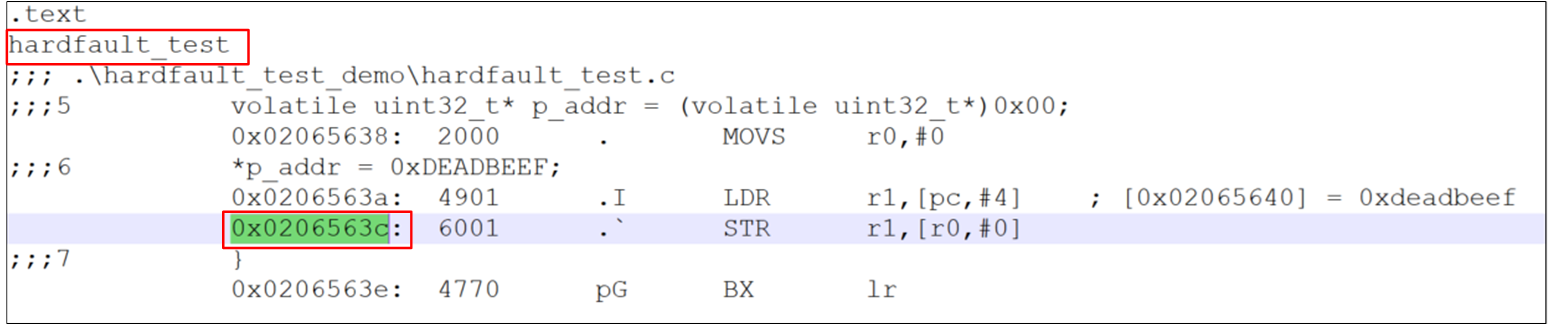
Hardfault Locate Code
-
Trace the Caller
Check LR =
0x0031471B.In the
.mapfile, see which function calledhardfault_test:main.
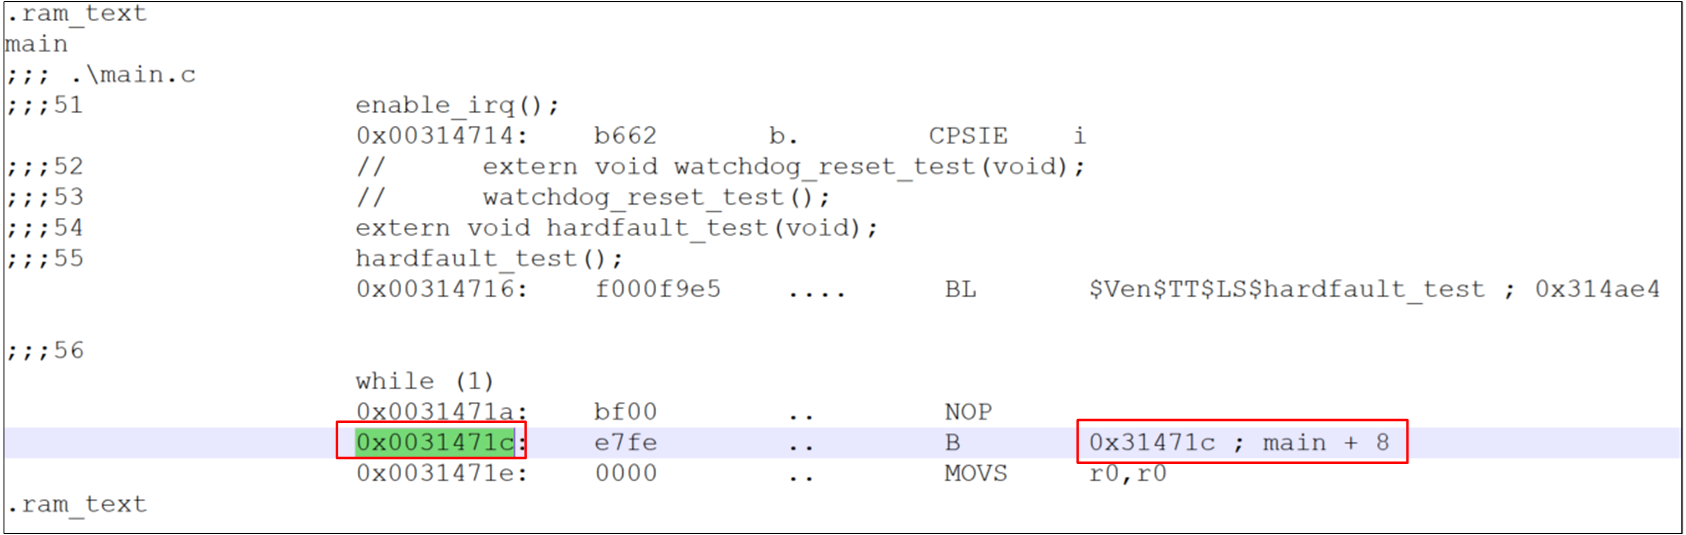
Hardfault Locate Caller
Complex Case Analysis (Call Chain Reconstruction Example)
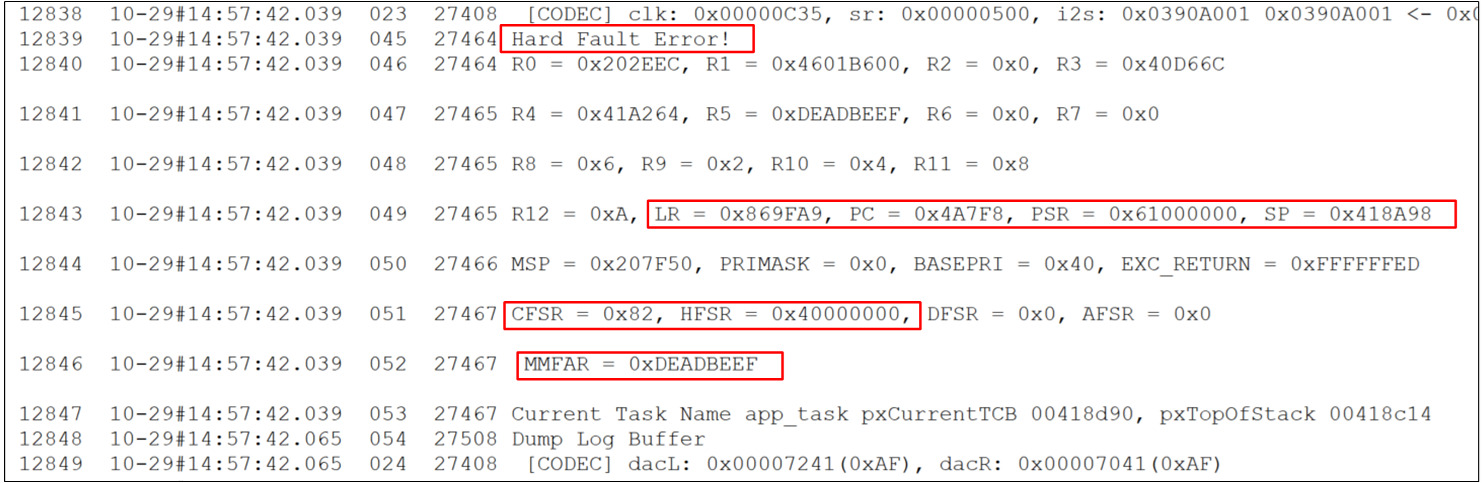
Complex Case Diagram
Determine the Fault Type & Fault Address
HFSR = 0x40000000
CFSR = 0x82 (0x00000082)
MMFAR = 0xDEADBEEF
-
HFSR (HardFault Status Register)
Focus: Bit 30 (FORCED)
Explanation: If 1, the HardFault was escalated from another fault. You must inspect CFSR.
-
CFSR (Configurable Fault Status Register)
Example value:
0x82 (0x00000082)-
Bit breakdown:
Bit 7 (MMARVALID): 1 → The address in MMFAR is valid.
Bit 1 (DACCVIOL): 1 → Data Access Violation; the MPU blocked the access.
-
MMFAR (MemManage Fault Address Register)
Example:
0xDEADBEEFExplanation: This is the specific memory address that caused the crash. The program tried to read/write this illegal address.
Call Stack Backtracking Principle
When a function is called, the return address (LR) is stored on the stack. To trace back the call chain, you need to analyze how many registers were pushed onto the stack and how much stack space was allocated.
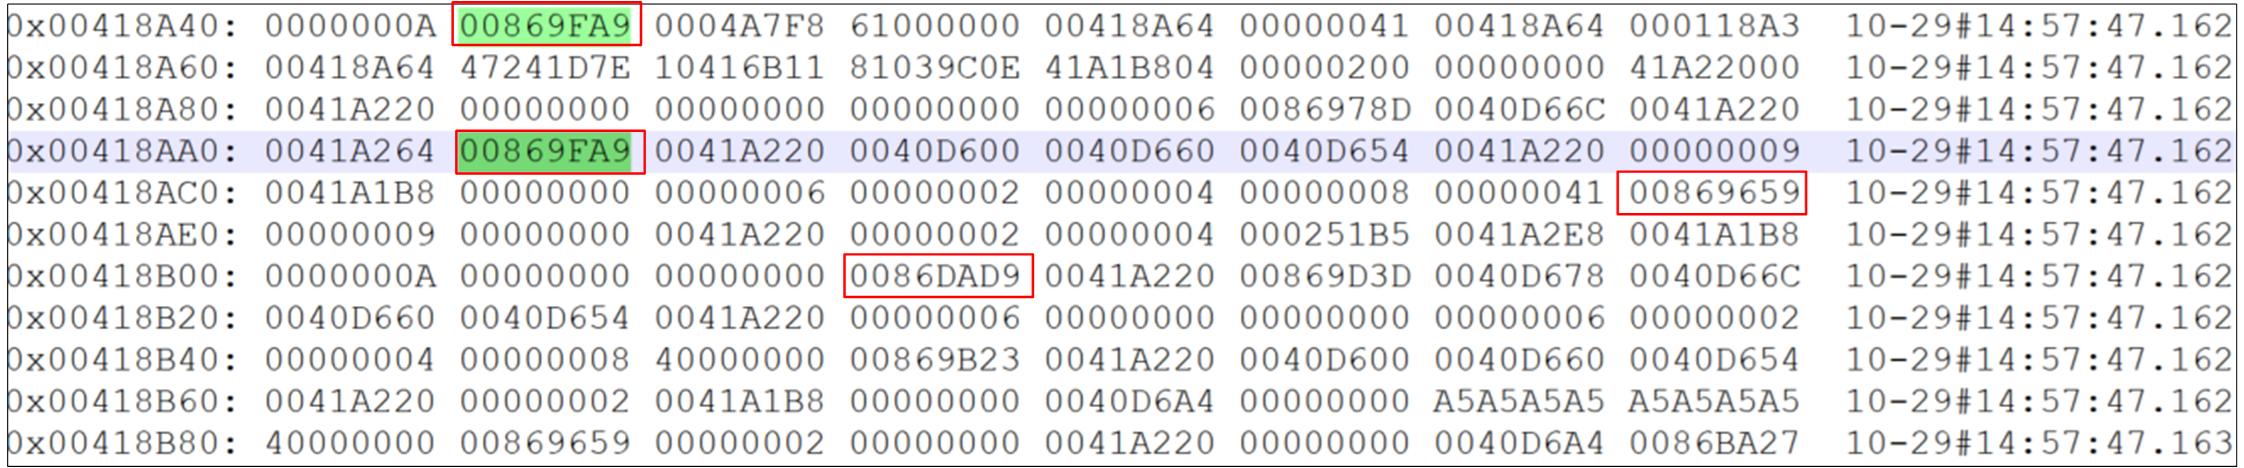
Call Chain Analysis
PC :
0x4A7F8LR :
0x869FA9
-
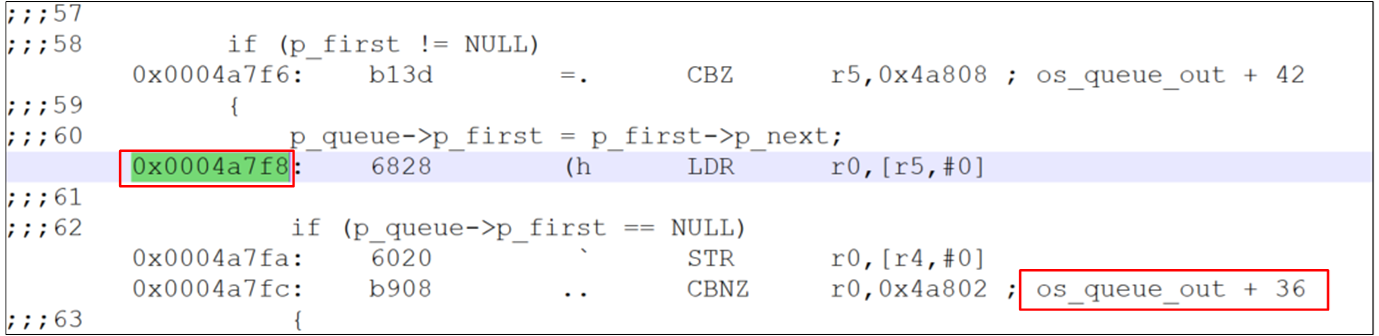
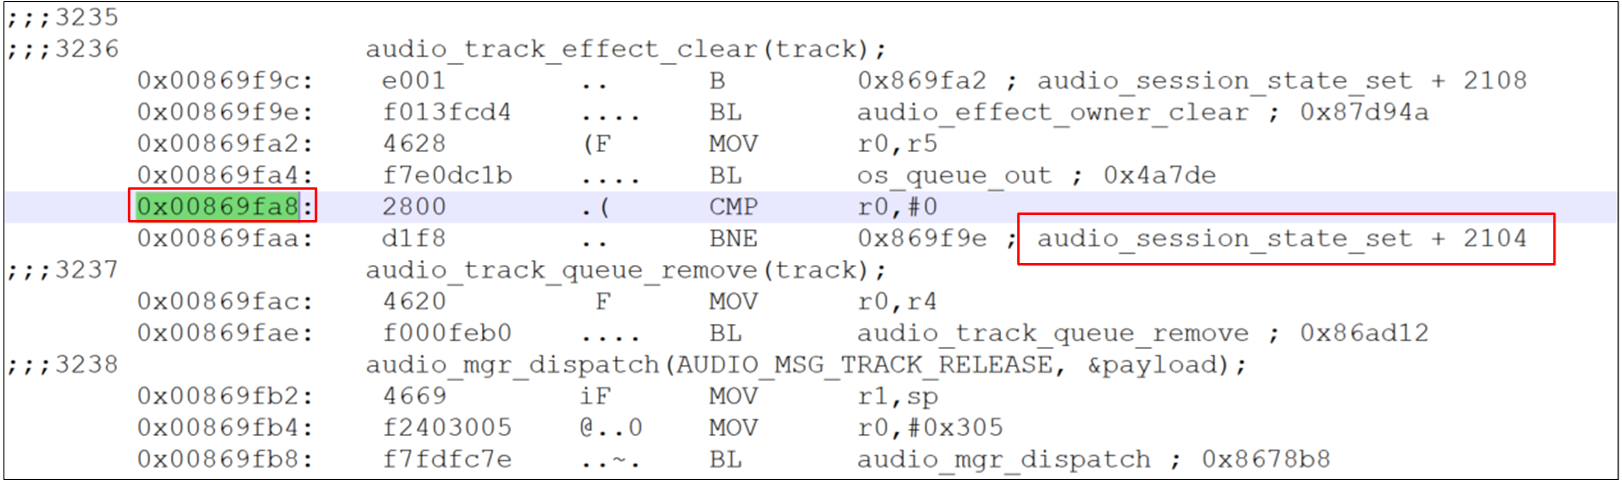
First-Level Trace (Register-Level)
Check PC (
0x4A7F8): points to functionos_queue_out; the fault occurred while accessing the next pointer.Check LR (
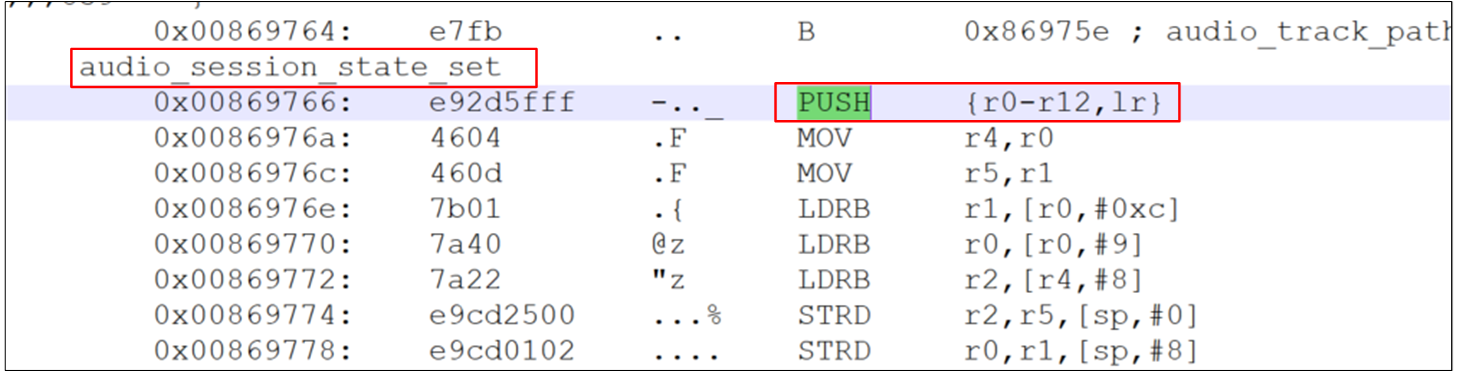
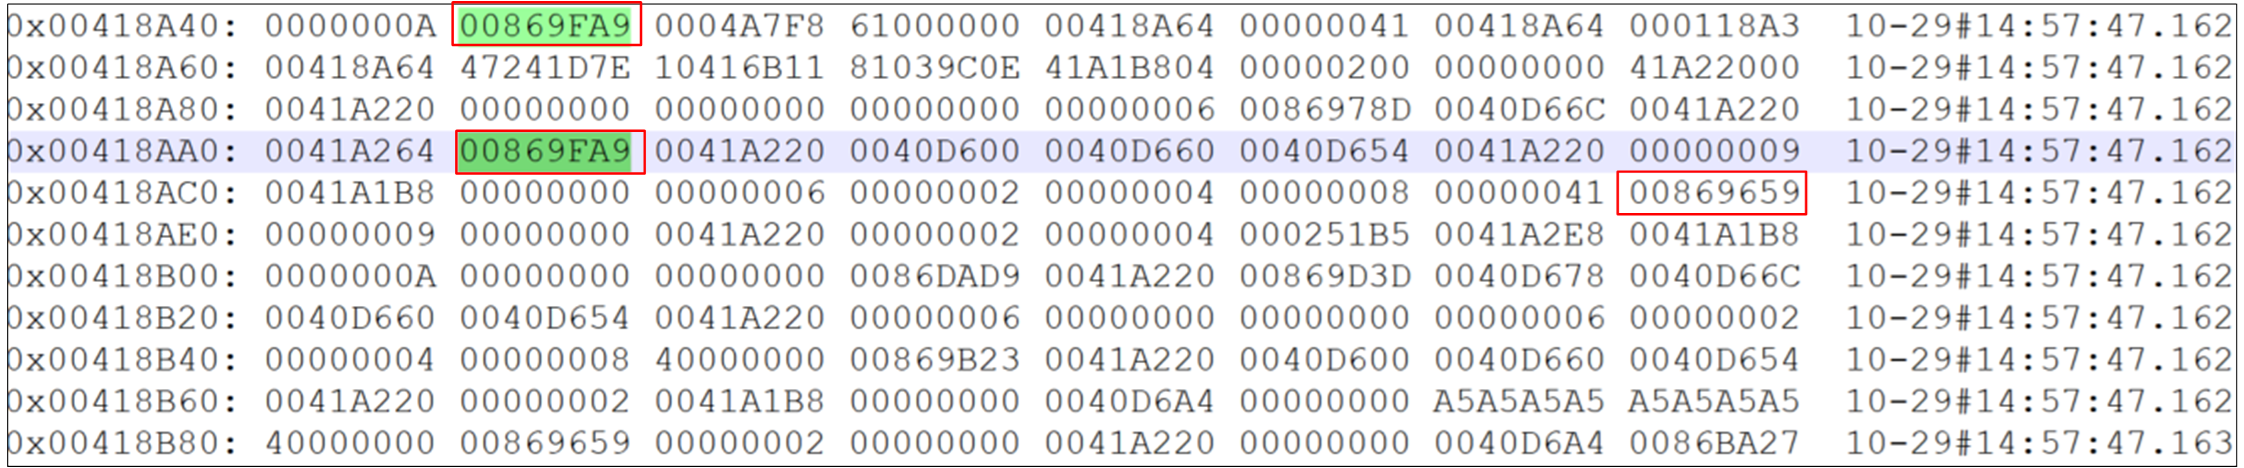
0x869FA9): points to the calleraudio_session_state_set.
Complex Hardfault PC Locate
Complex Hardfault LR_1 Locate
Complex Hardfault Stack Info 1
-
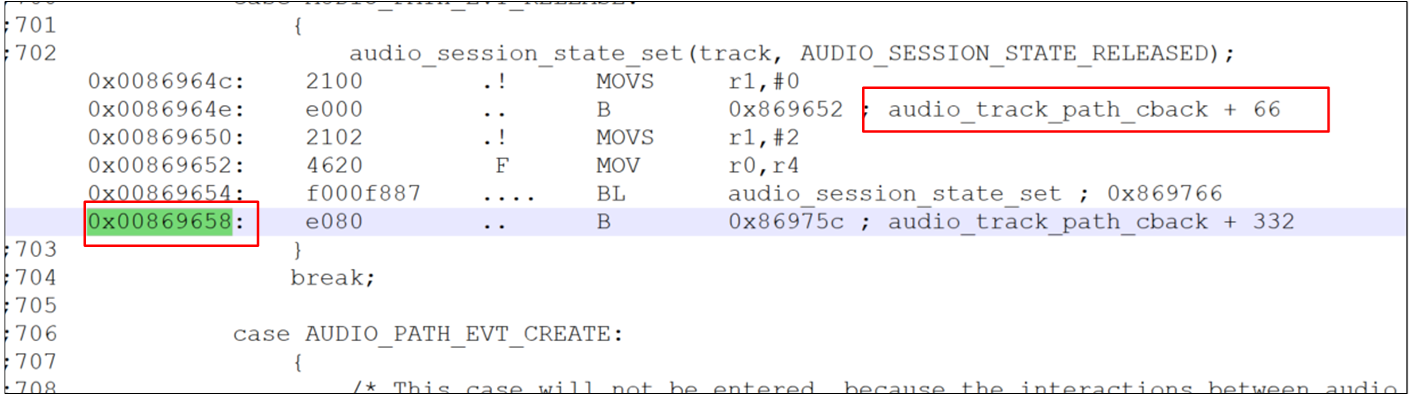
Second-Level Trace (Stack-Level - Simple PUSH)
Scenario: Find the caller of
audio_session_state_set.Behavior: The function PUSHed 13 registers.
Calculation: Move down 13 words in the stack.
Result: New LR =
0x00869659→ corresponds toaudio_track_path_cback.
Complex Hardfault Stack Info 2
Complex Hardfault LR_2 Locate
-
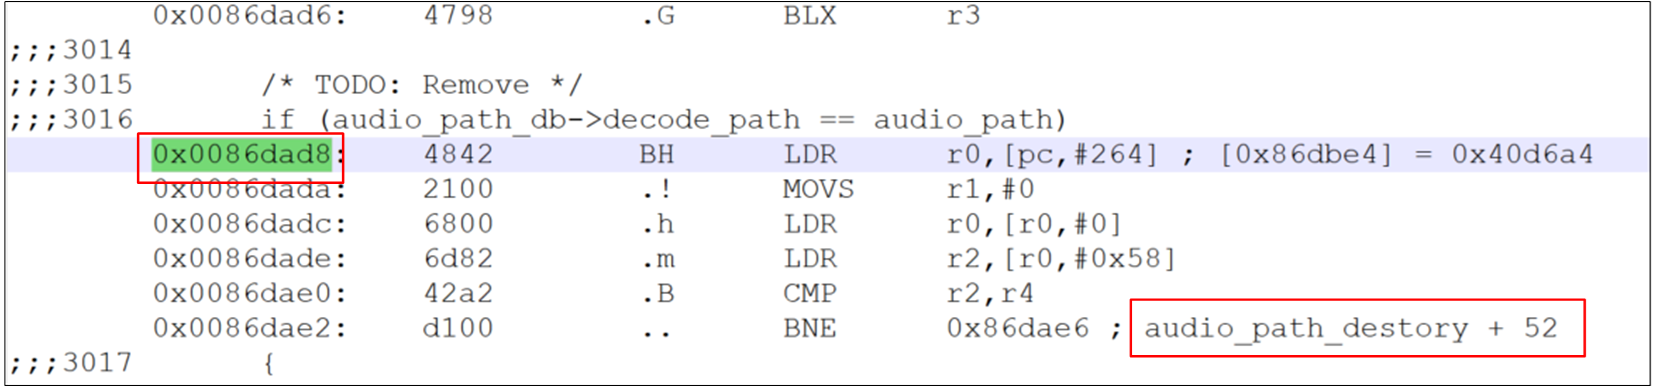
Third-Level Trace (Stack-Level - Complex PUSH + SUB)
Scenario: Find the caller of
audio_track_path_cback.Assembly analysis:
push {r4–r7, ...}→ pushed 4 registers.sub sp, #0x1c→ allocated 28 bytes of stack space.
Math:
Offset = 4 + (28 / 4) = 11 words.
Action: From the current position, move down 11 words in the stack record.
Result: New LR =
0x0086DAD9→ corresponds toaudio_path_destory.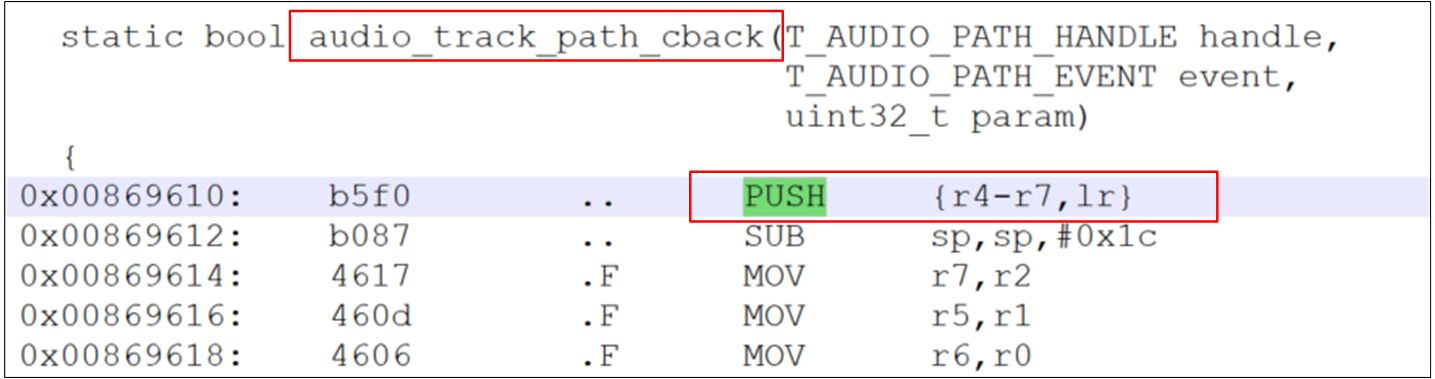
Complex Hardfault LR_3 Locate
Complex Hardfault Stack Info 3
Complex Hardfault LR_4 Locate
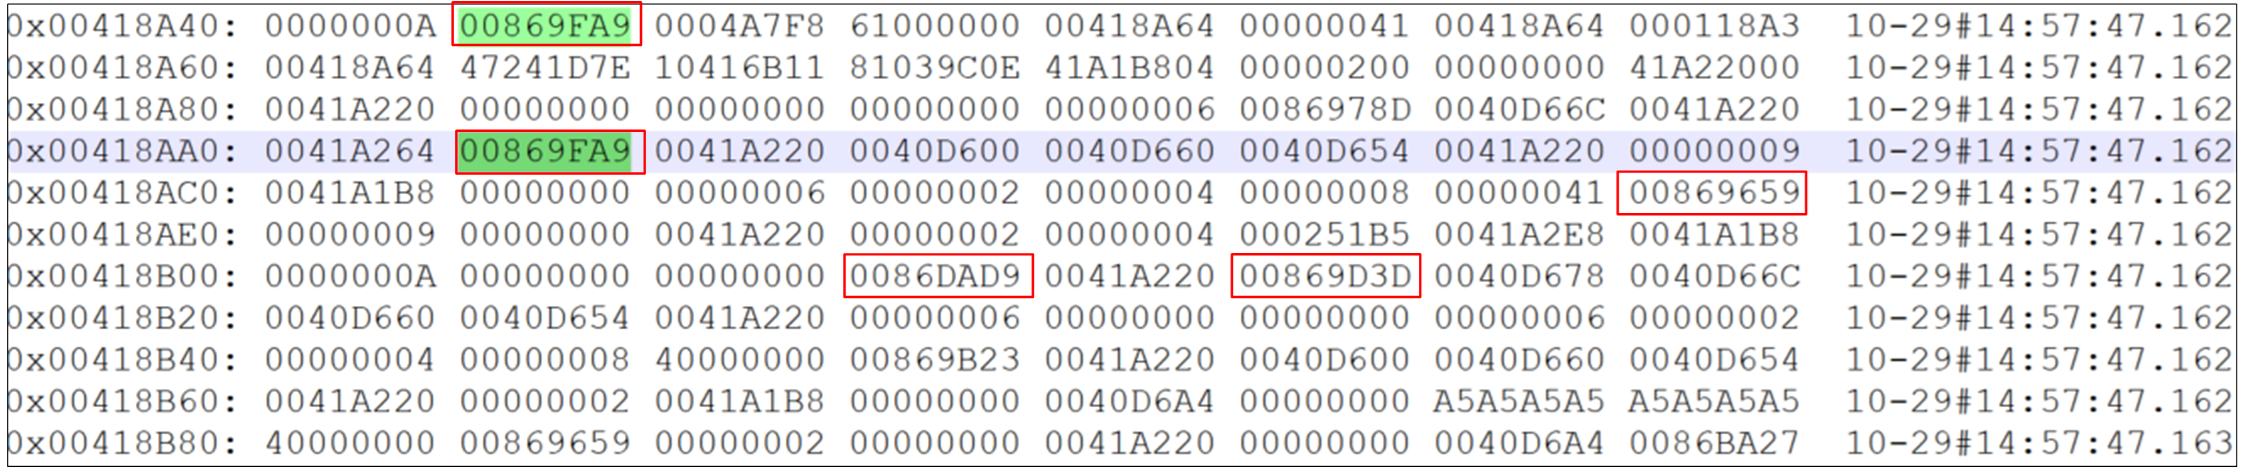
-
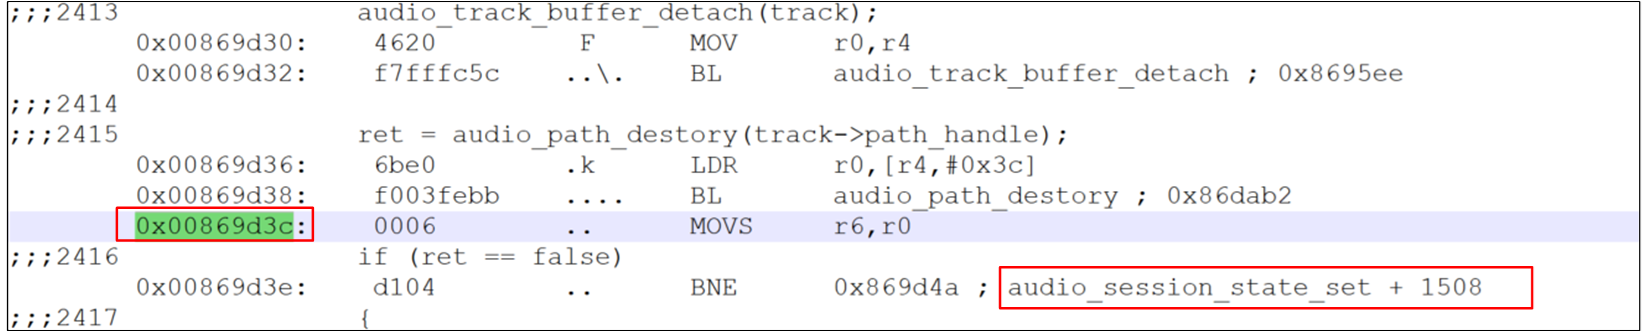
Fourth-Level Trace (Loop Logic)
Scenario:
audio_path_destoryonly pushed one register.Calculation: Move down 1 word.
Result: Found address
0x00869D3C.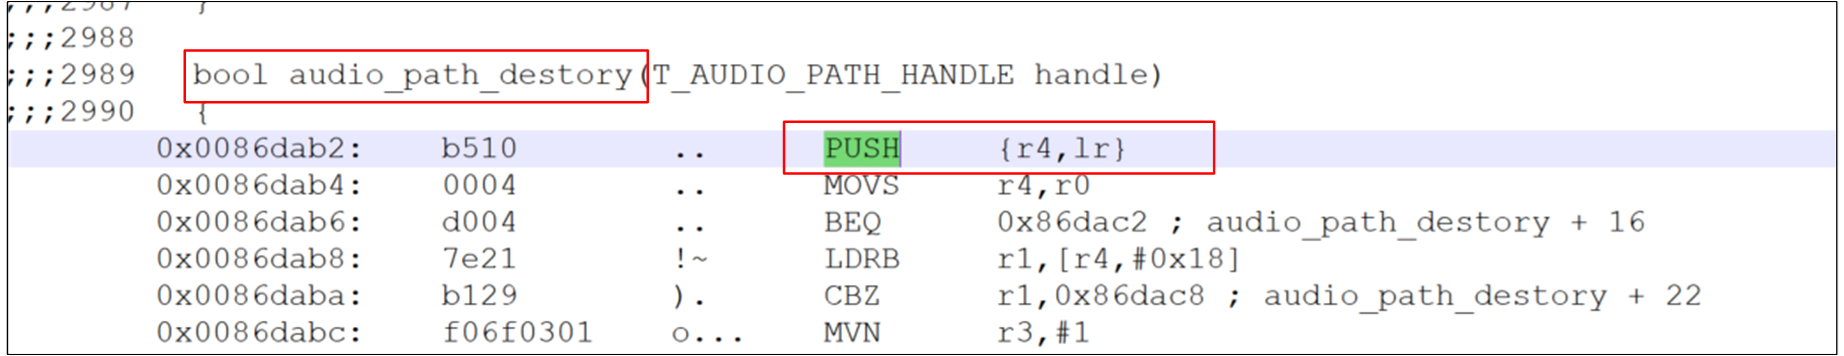
Complex Hardfault LR_5 Locate
Complex Hardfault Stack Info 4
Complex Hardfault LR_6 Locate
Continue this step-by-step downward analysis of the call chain to identify the root cause of the HardFault.